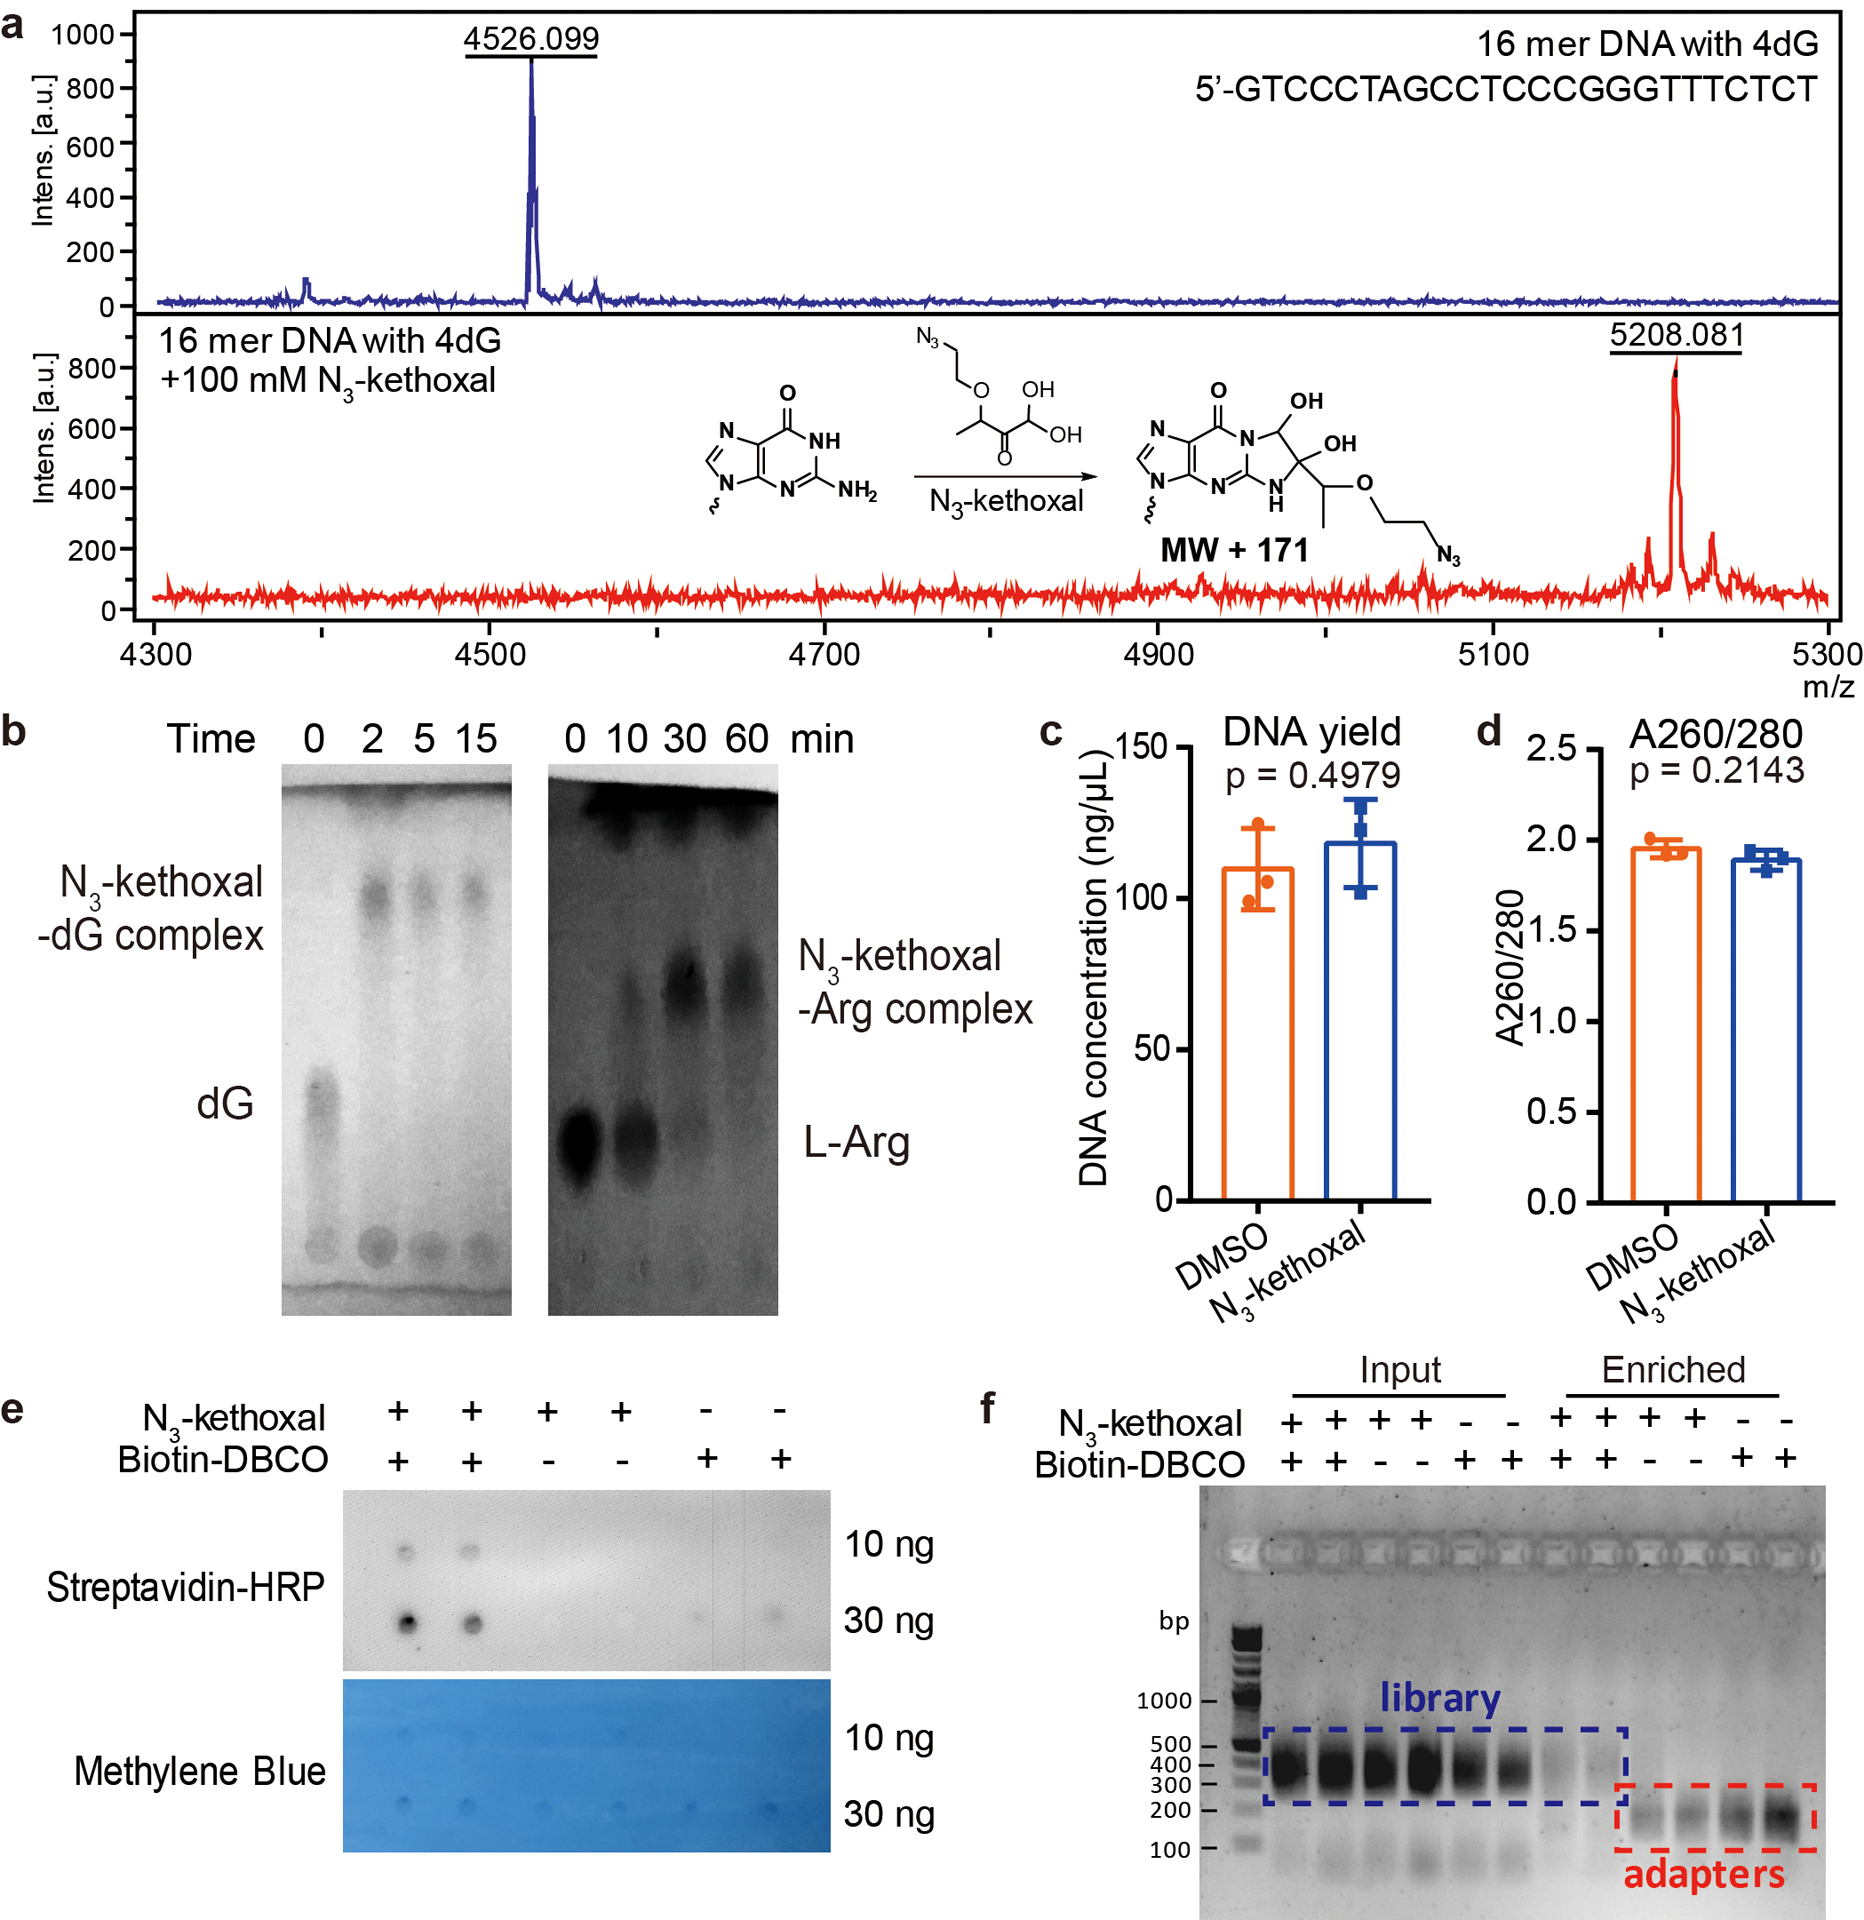
Extended Data Fig. 1. Characterization of the N3-kethoxal-based labeling.

a, MALDI-TOF analysis of the reaction between a 16-mer DNA oligo and N3-kethoxal. The experiment was performed in duplicates with similar results obtained. b, TLC analysis of the reaction between N3-kethoxal and deoxyguanosine (dG, left) or L-arginine (L-Arg, right) after different time intervals. The N3-kethoxal-dG results were visualized by 254 nm UV light. The N3-kethoxal-L-Arg results were visualized by ninhydrin staining. The experiment was performed in duplicates with similar results obtained. c-d, The DNA yield (c) and the A260/280 ratio (d) of gDNA isolated from N3-kethoxal-treated and control cells. P values were calculated by using two-sided unpaired Student’s t-test (n = 3 independent experiments). e, Dot blot showing biotin signals of the DNA after the biotinylation reaction in the presence or absence of N3-kethoxal or biotin-DBCO. Results from two replicates were shown for each condition. The experiment was performed in duplicates with similar results obtained. f, Agarose gel image showing the profile of libraries constructed by using input and enriched DNA samples made in the presence or absence of N3-kethoxal or biotin-DBCO. Results from two replicates were shown for each condition. The experiment was performed in duplicates with similar results obtained.
