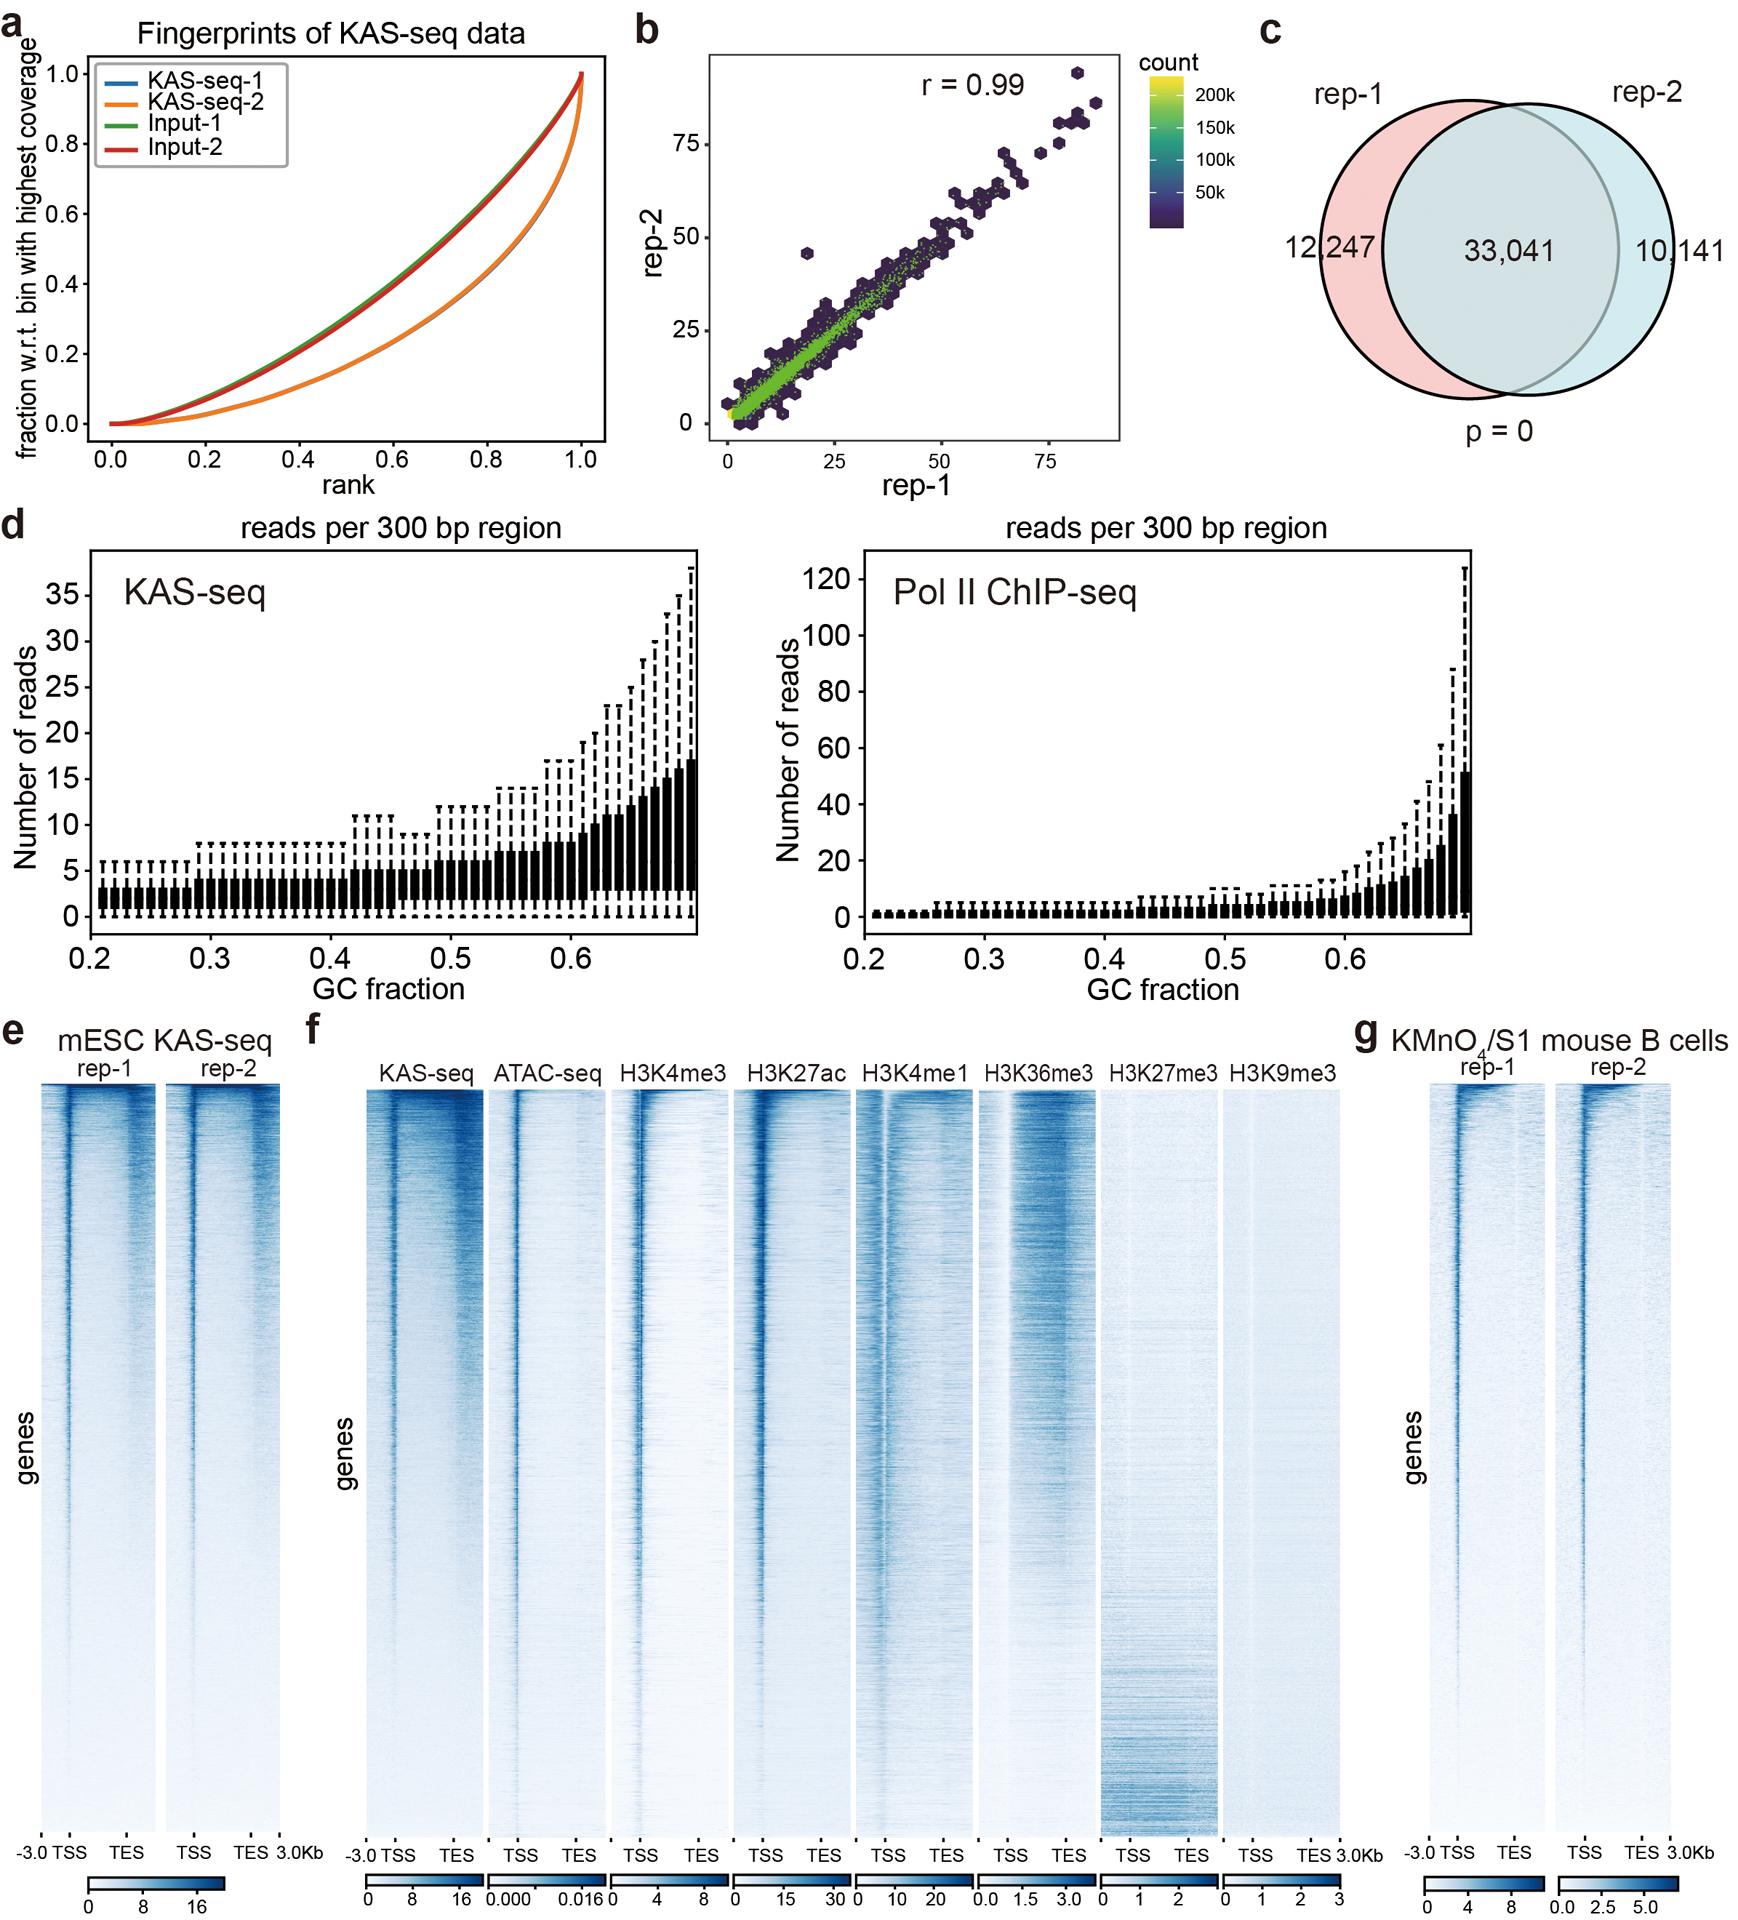
Extended Data Fig. 2. KAS-seq validation and an overview of the KAS-seq profile.

a, Fingerprint plot of KAS-seq libraries and the corresponding inputs in HEK293T cells. b, Pearson correlation scatterplot between two independent KAS-seq replicates (r = 0.99) in HEK293T cells (n = 287,970 10 Kb bins in the hg19 genome). c, Peak overlaps between two independent KAS-seq replicates in HEK293T cells. The p value was calculated using two-sided Fisher’s exact test. d, Reads distributions of KAS-seq (left) and Pol II ChIP-seq (right) signals respect to different GC fractions. e, Heatmap showing reads distribution of two independent KAS-seq replicates at gene-coding regions in mESCs. f, The distribution of KAS-seq signals, ATAC-seq signals, and selected histone modifications at gene-coding regions in HEK293T cells. g, Heatmap showing the reads distribution of two KMnO4/S1 footprinting replicates (activated mouse B cells) at gene-coding regions.
