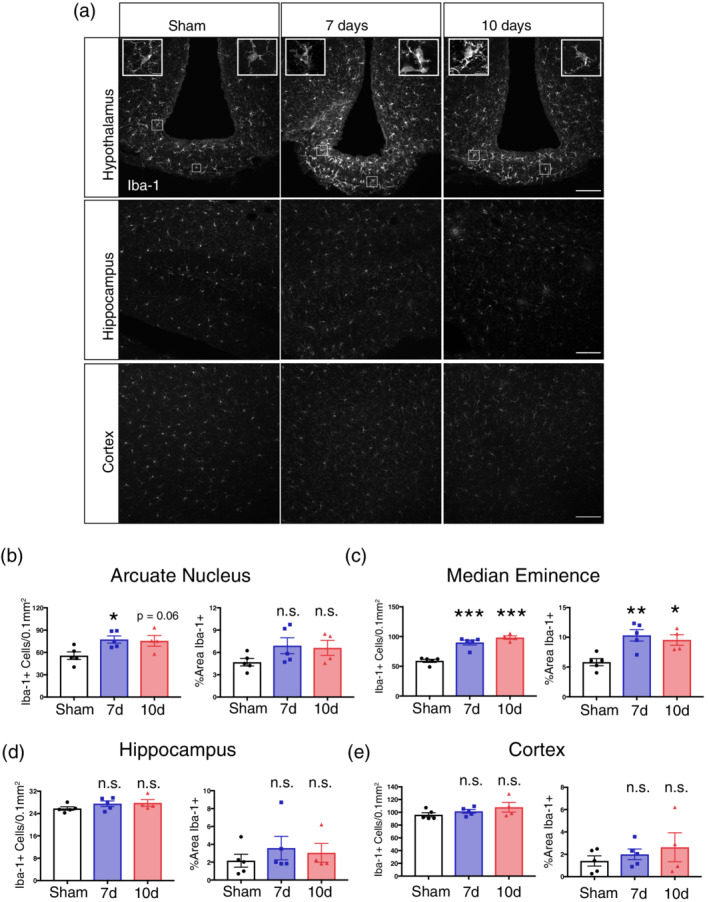
Figure 1.

Microgliosis occurs in the MBH throughout PDAC cachexia. (a) Representative confocal microscopy images of Iba‐1 immunoreactivity within the MBH, hippocampus, and cortex from either a sham, 7 dpi, or 10 dpi mouse brain. Scale bar = 100 μm. Top left inset = arcuate nucleus microglia within left box. Top right inset = median eminence microglia within right box. Inset scale bars = 10 μm. B‐E) Analysis of microglia number (left) or percent area Iba‐1+ (right) in the arcuate nucleus, median eminence, hippocampus, or cortex. n.s. = not significant, ***p < .001, **p < .01, *p < .05 compared to sham in one‐way ANOVA analysis [Color figure can be viewed at wileyonlinelibrary.com]
