Figure 2.

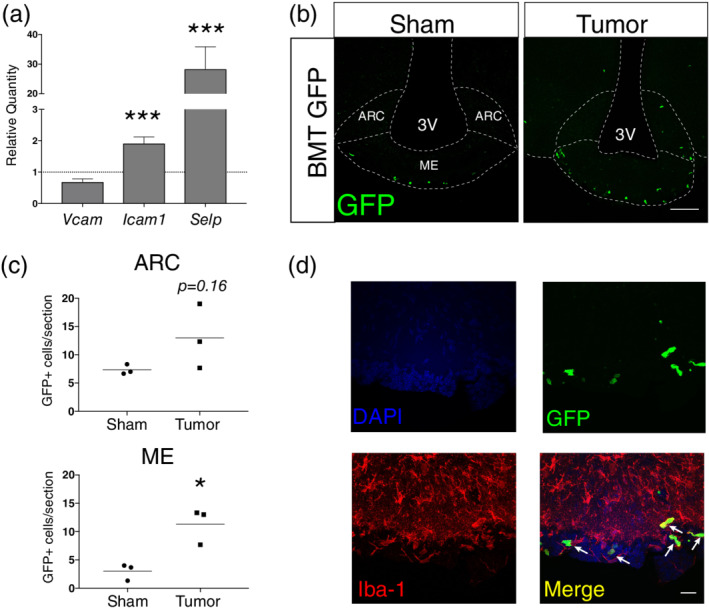
Circulating immune cells infiltrate the MBH during PDAC. a) qRT‐PCR analysis for leukocyte adhesion molecule transcripts in RNA extracted from whole hypothalamic at 10 dpi. Results are relative to sham. ***p < .001 relative to sham comparing ΔCt values in repeated measures one‐way ANOVA. Results consist of two independent experiments combined. n = 4–8/group. (b) Representative 20X confocal images MBH from sham and tumor (10 dpi) mice with median eminence and arcuate nucleus labeled on sham section. ME = median eminence. ARC = arcuate nucleus. Scale bar = 100 μm. (c) Quantification of B. *p < .05 compared to sham in t‐test. n = 3/group. (d) Representative 60× image of ME from BMT GFP tumor mouse, at 10 dpi. Scale bar = 20 μm. Arrows = GFP + Iba‐1+ infiltrating macrophages [Color figure can be viewed at wileyonlinelibrary.com]
