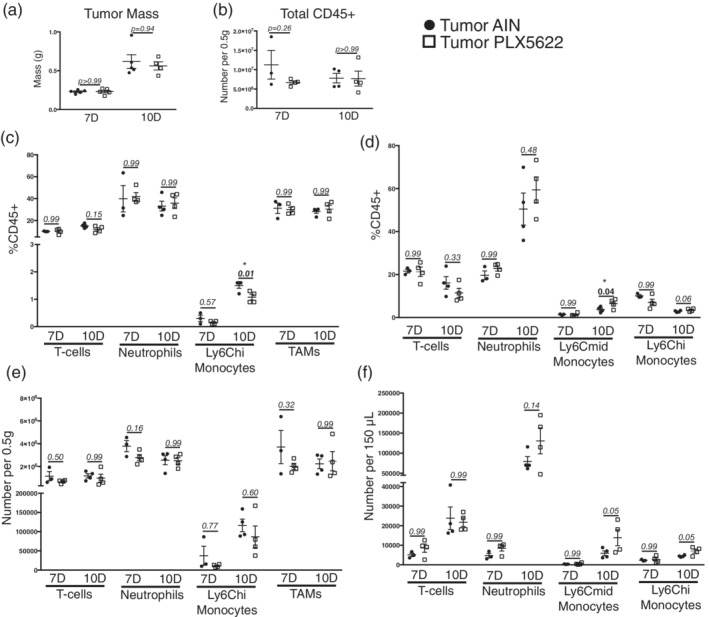
Figure 6.

Minimal change in circulating and tumor‐associated immune cells after PLX5622 administration during PDAC. (a) Tumor mass in both AIN‐treated and PLX5622‐treated KPC‐bearing animals at 7 and 10 dpi. For all comparisons shown in this figure, p values reflect those from Bonferroni post‐hoc analysis in one‐way ANOVA analysis. (b) Total CD45+ cells in the tumors of AIN‐treated and PLX5622‐treated KPC‐bearing animals at 7 and 10 dpi. (c) Relative number of immune cells in the tumors of AIN‐treated and PLX5622‐treated KPC‐bearing animals at 7 and 10 dpi, expressed as a percentage of total CD45+ cells. (d) Relative number of immune cells in the blood of AIN‐treated and PLX5622‐treated KPC‐bearing animals at 7 and 10 dpi, expressed as a percentage of total CD45+ cells. (e) and (f) Total number of immune cells in the tumor (e) and blood (f) in AIN‐treated and PLX5622‐treated KPC‐bearing animals at 7 and 10 dpi n = 3–4/group
