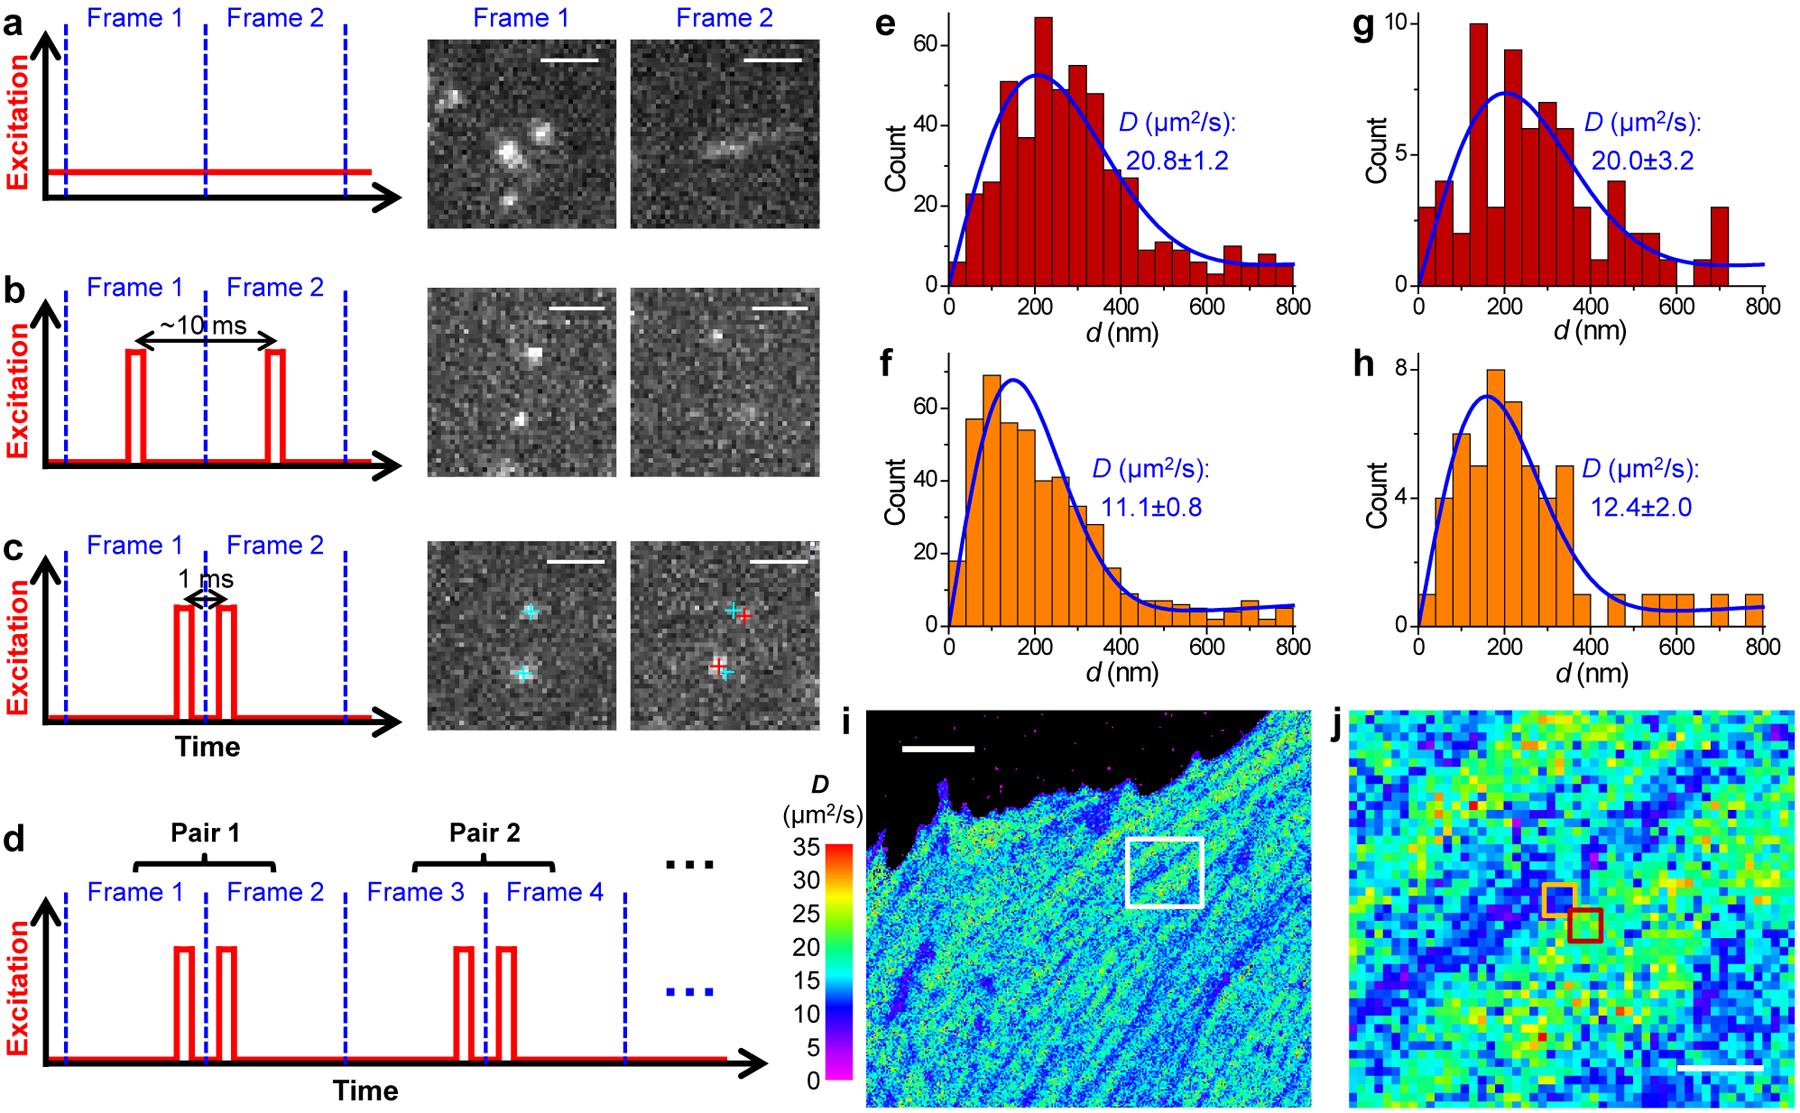
Fig. 1 |. SMdM for single mEos3.2 FP molecules freely diffusing in the cytoplasm of live mammalian cells.

(a) Conventional imaging with continuous laser illumination and a recording framerate of 109 Hz. (b) Stroboscopic illumination, with excitation pulses τ = 500 μs in duration synchronized to the center of each camera frame. (c) Placing two excitation pulses towards the end of the first frame and the beginning of the second frame, respectively, so that the center-to-center time separation between the two recorded images is reduced to 1 ms. Cyan and red crosses mark the super-localized positions of two detected molecules in Frame 1 and Frame 2, respectively. (d) Such paired frames are repeated ~104 times to enable statistics. (e,f) Distribution of the 1-ms single-molecule displacement d for two adjacent 300×300 nm2 areas [red and orange boxes in (j)]. (g,h) Distribution of d for two 100×100 nm2 areas at the centers of (e,f), respectively. Blue curves in (e-h) give MLE results using eqn. 2 in Methods, with resultant diffusion coefficient D and uncertainty σ labeled in each panel. (i,j) Map of intracellular diffusivity constructed through MLE of the d distribution in every 100×100 nm2 spatial bin. (j) is a zoom-in of the white box in (i). Scale bars: 2 μm (a-c), 5 μm (i), 1 μm (j). (i) and (j) were independently repeated 11 times with similar results.
