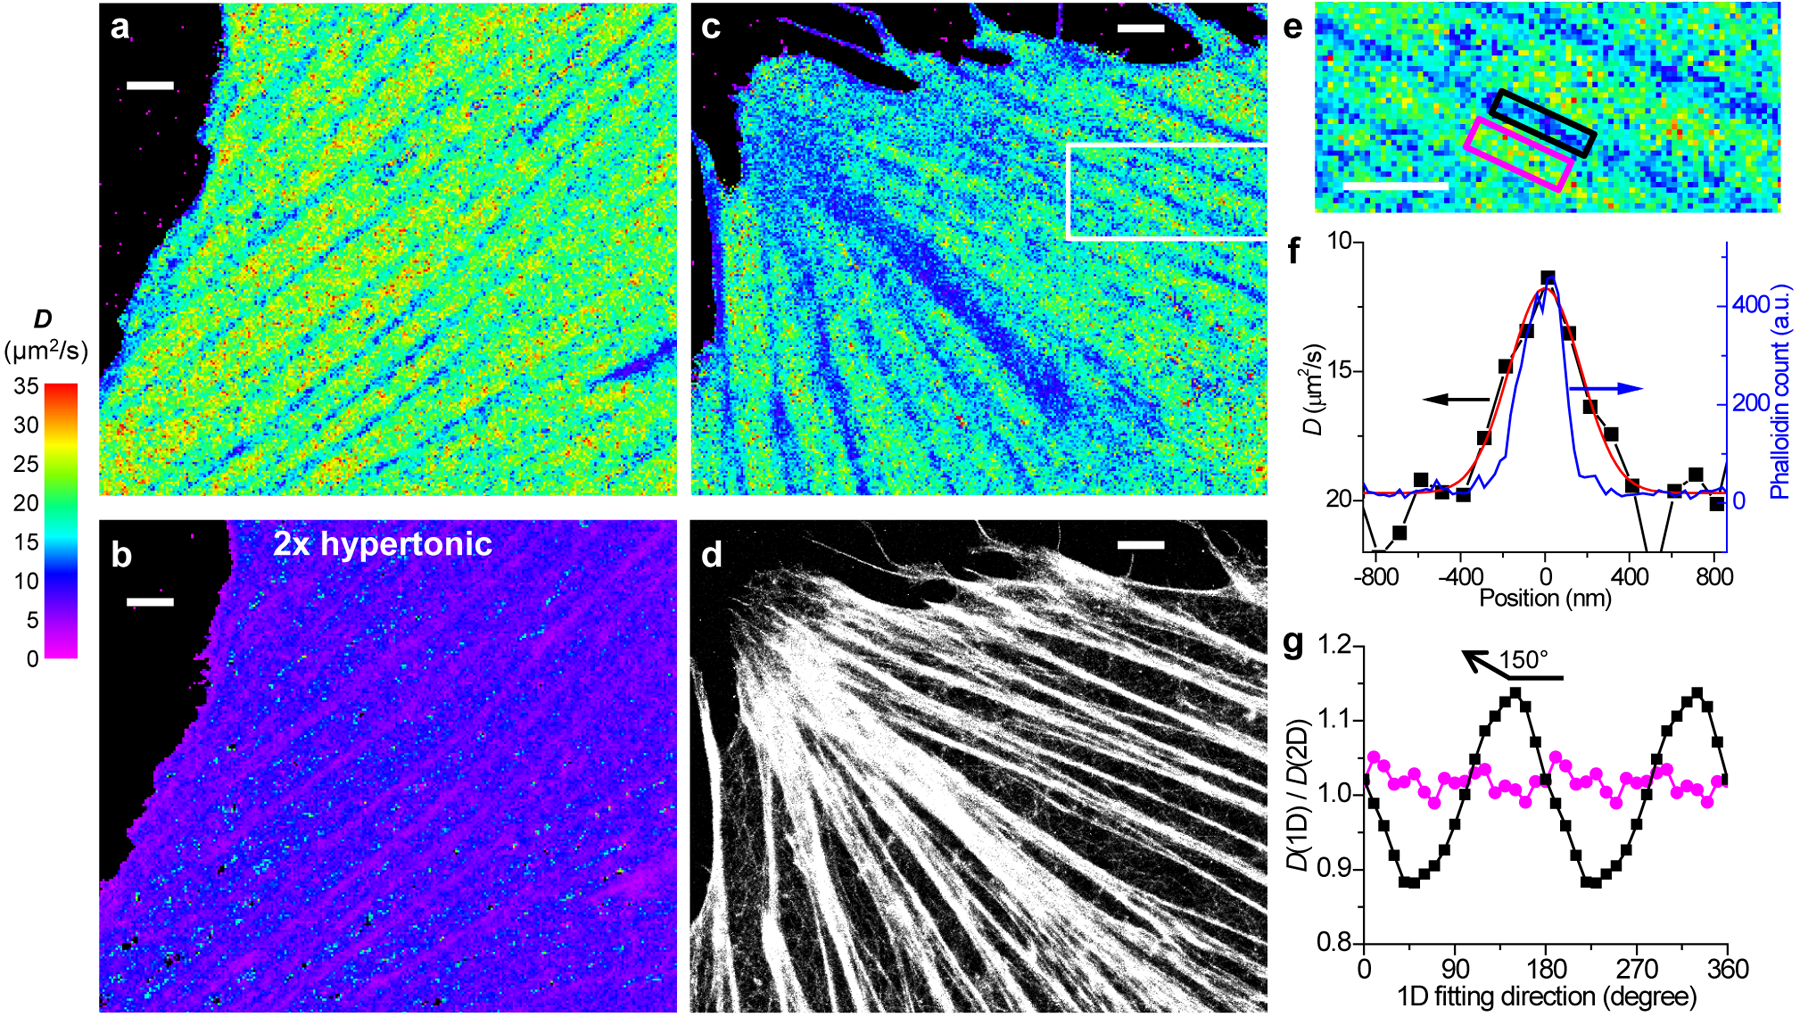
Fig. 2 |. SMdM of free mEos3.2 in the mammalian cytoplasm and correlated SMLM of the actin cytoskeleton.

(a) SMdM diffusivity map of mEos3.2-C1 in the cytoplasm of a live PtK2 cell. (b) The same cell in a 2× hyperosmotic medium. (a) and (b) were independently repeated 3 times with similar results. (c,d) Correlated SMdM diffusivity map of mEos3.2 in another live PtK2 cell (c), vs. SMLM image of Alexa Fluor 647 phalloidin-labeled actin in the fixed cell (d). (e) Zoom-in of the white box in c. (c), (d) and (e) were independently repeated 5 times with similar results. (f) Variations in the SMdM-measured D value (black squares on a flipped y-axis; red line: Gaussian fit with an FWHM of 400 nm) and the SMLM-detected phalloidin density (blue curve; FWHM is 230 nm; see y-axis on the right) across the black-boxed region in e. (g) Ratio of the D values obtained from the direction-dependent 1D diffusion models over that from the 2D isotropic model, for the black- and magenta-boxed regions in e, respectively. The D values from the 2D isotropic model are 12.4 and 21.8 μm2/s for the two regions, respectively. Scale bars: 2 μm (a-e).
