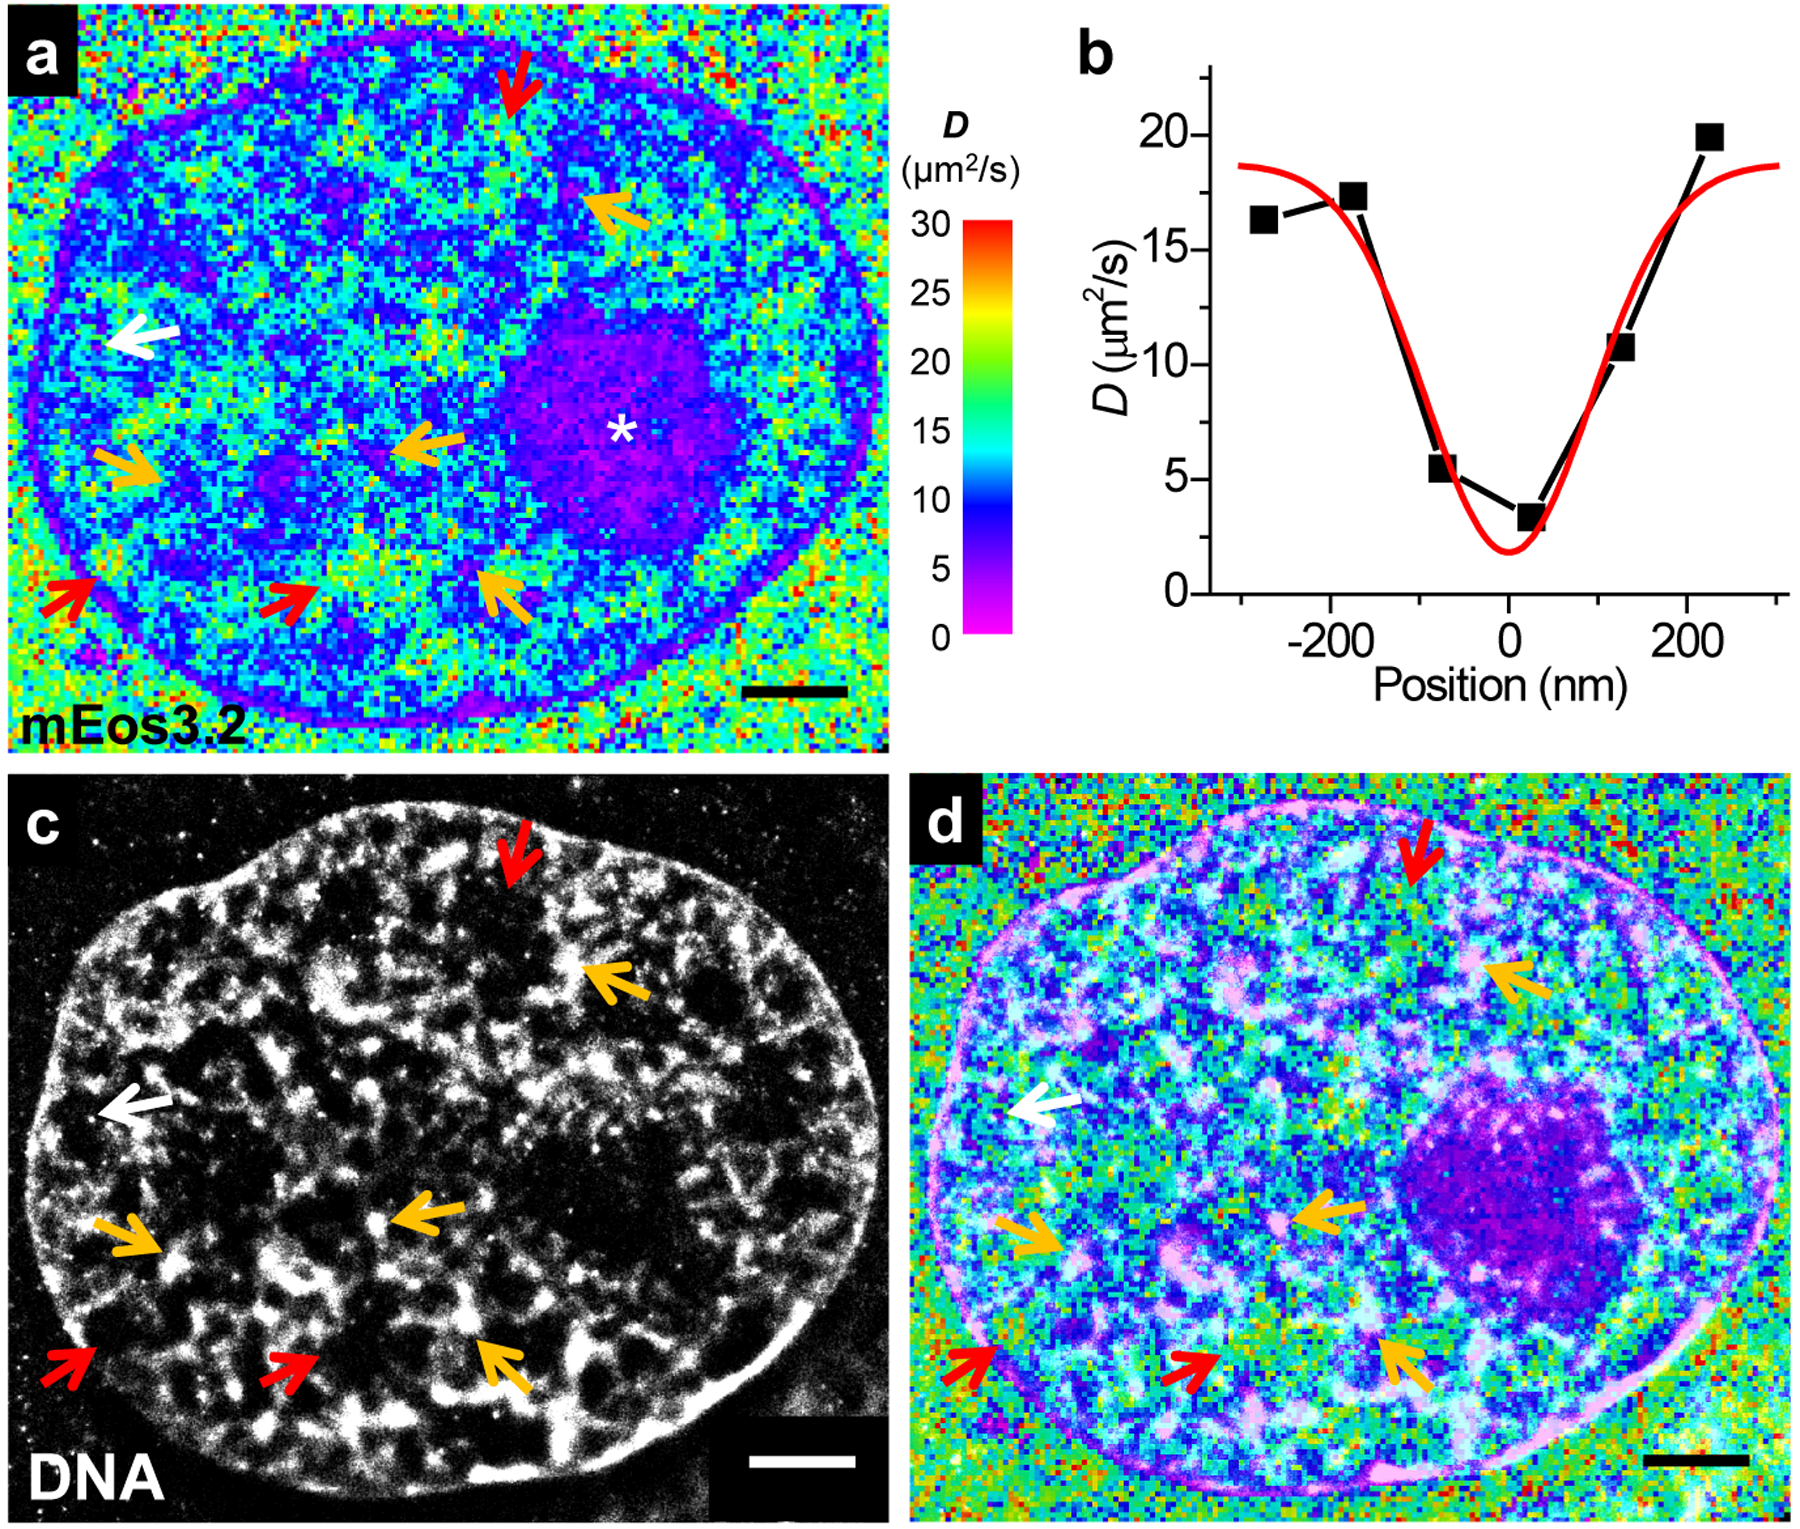
Fig. 3 |. SMdM of free mEos3.2 in the nucleus, and correlated SMLM of DNA.

(a) SMdM diffusivity map of mEos3.2-C1 at the central depth of the nucleus of a live PtK2 cell. (b) Variation in the SMdM-determined D along the horizontal direction for a spot-like structure marked by the white arrow in a. Red line: Gaussian fit with an FWHM of 220 nm. (c) SMLM image of the fixed cell using the DNA stain NucSpot Live 650. (d) Overlay of (a) and (c). Scale bars: 2 μm. These experiments were independently repeated 23 times with similar results.
