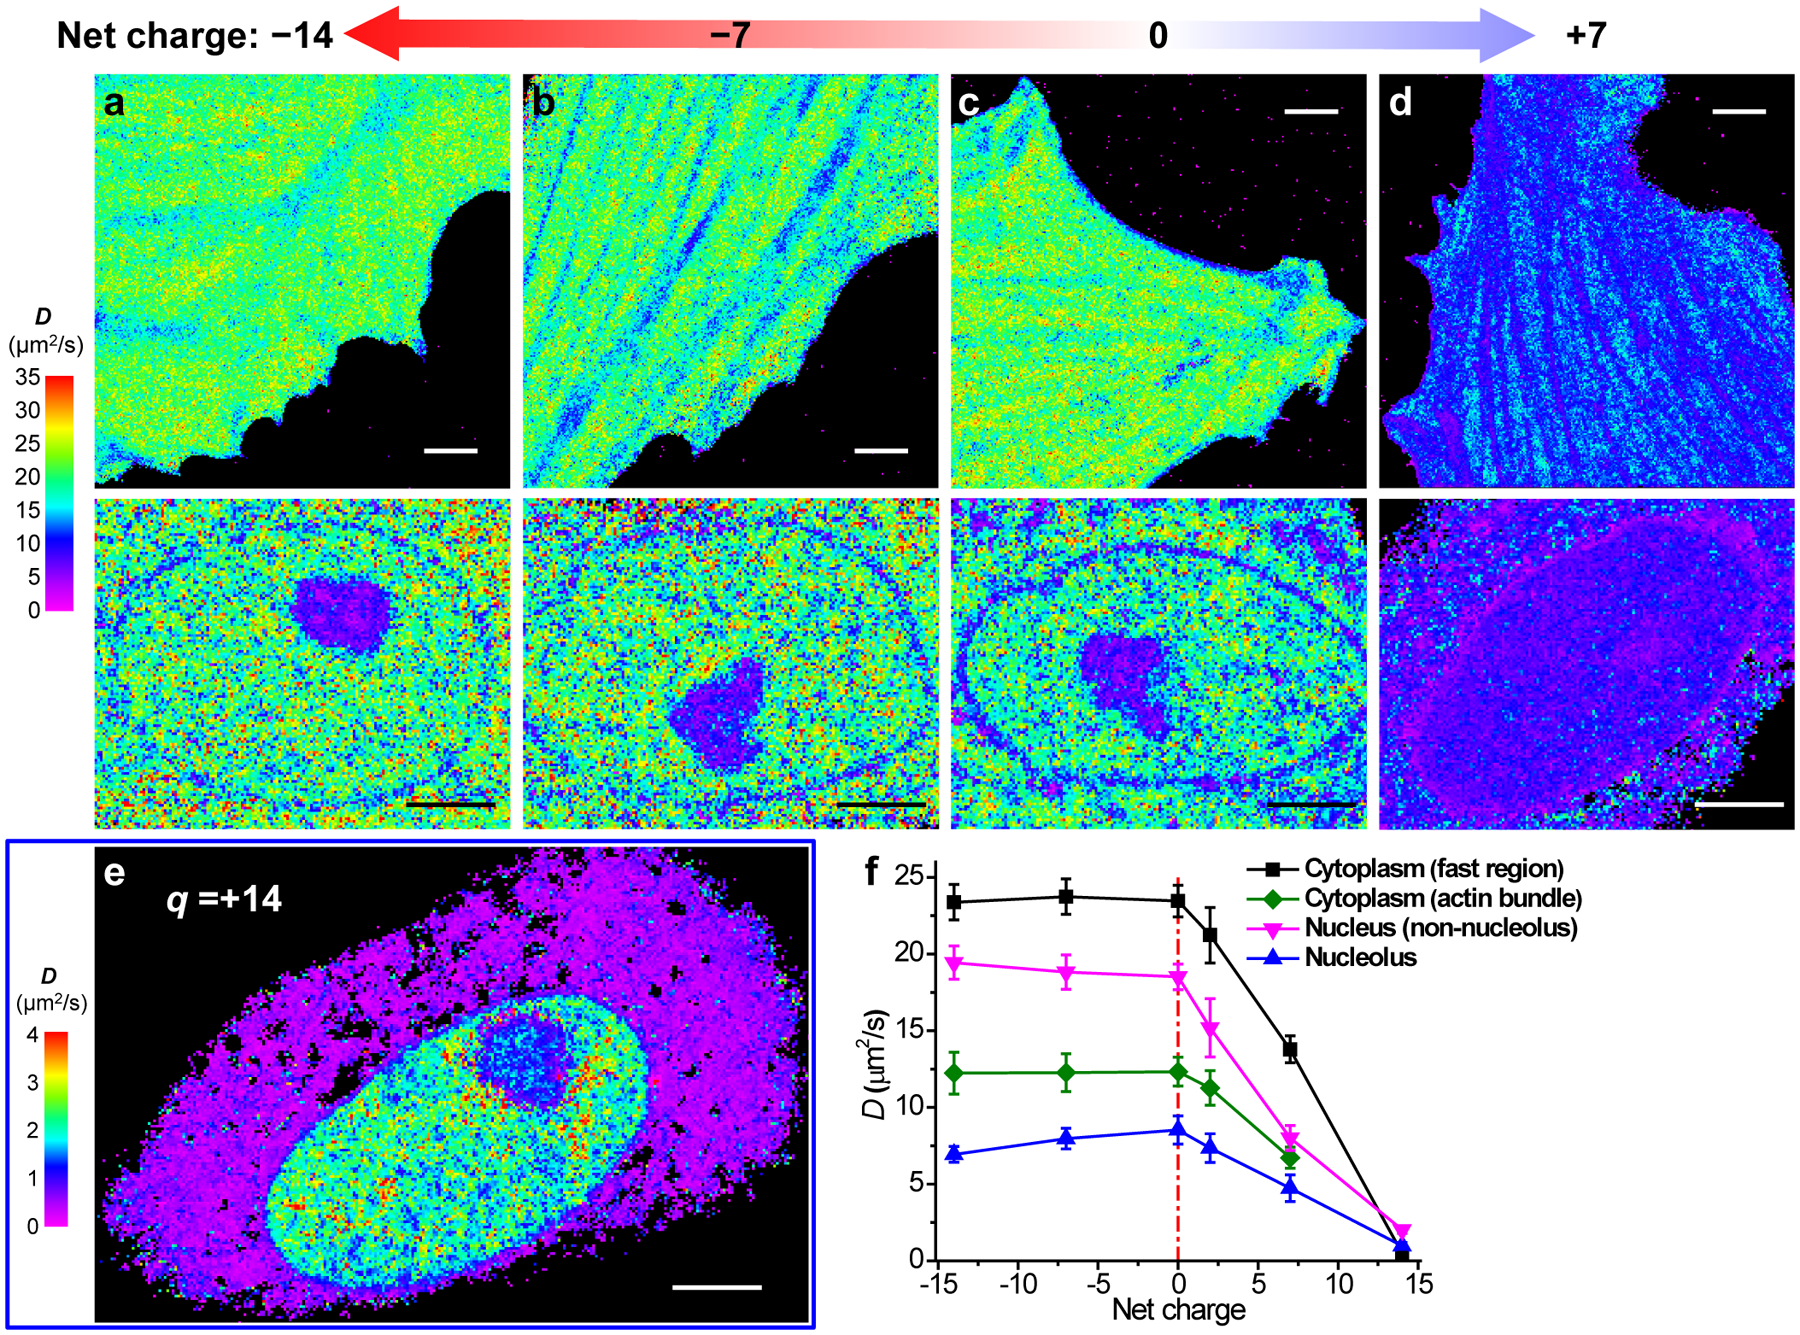
Fig. 4 |. SMdM of mEos3.2 species of different net charges.

(a-d) SMdM diffusivity maps of mEos3.2 species of −14 (a), −7 (b), 0 (c), and +7 (d) net charges expressed in live PtK2 cells. The top and bottom panels show representative results in the spread parts of cells and the nuclei, respectively. The experiments were independently repeated 6, 8, 7 and 9 times for (a), (b), (c) and (d) in cytosol, and 21, 22, 7 and 13 times for (a), (b), (c) and (d) in nucleus, with similar results. (e) SMdM diffusivity map of +14 charged mEos3.2 in a live PtK2 cell, on a substantially reduced D scale. The experiment was independently repeated 15 times with similar results. (f) Mean D values for the above proteins in different subcellular environments. For cytoplasm, averaged D is presented for fast regions with no apparent slowdown due to the actin cytoskeleton (black; n = 9 cells for +7 charge and n = 6 cells for the other charges), as well as for the actin-bundle regions (green; n = 6, 6, 7, 6, 9 cells for charges of −14, −7, 0, +2, +7, respectively). The nucleus data are simply divided into nucleolus (blue; n = 7, 7, 6, 10, 12, 6 cells for charges of −14, −7, 0, +2, +7, +14, respectively) and non-nucleolus (magenta; n = 7, 7, 7, 10, 13, 6 cells for charges of −14, −7, 0, +2, +7, +14, respectively) regions. Error bars: standard deviations between individual cells (n > 6 cells for each data point). Scale bars: 4 μm (a-e).
