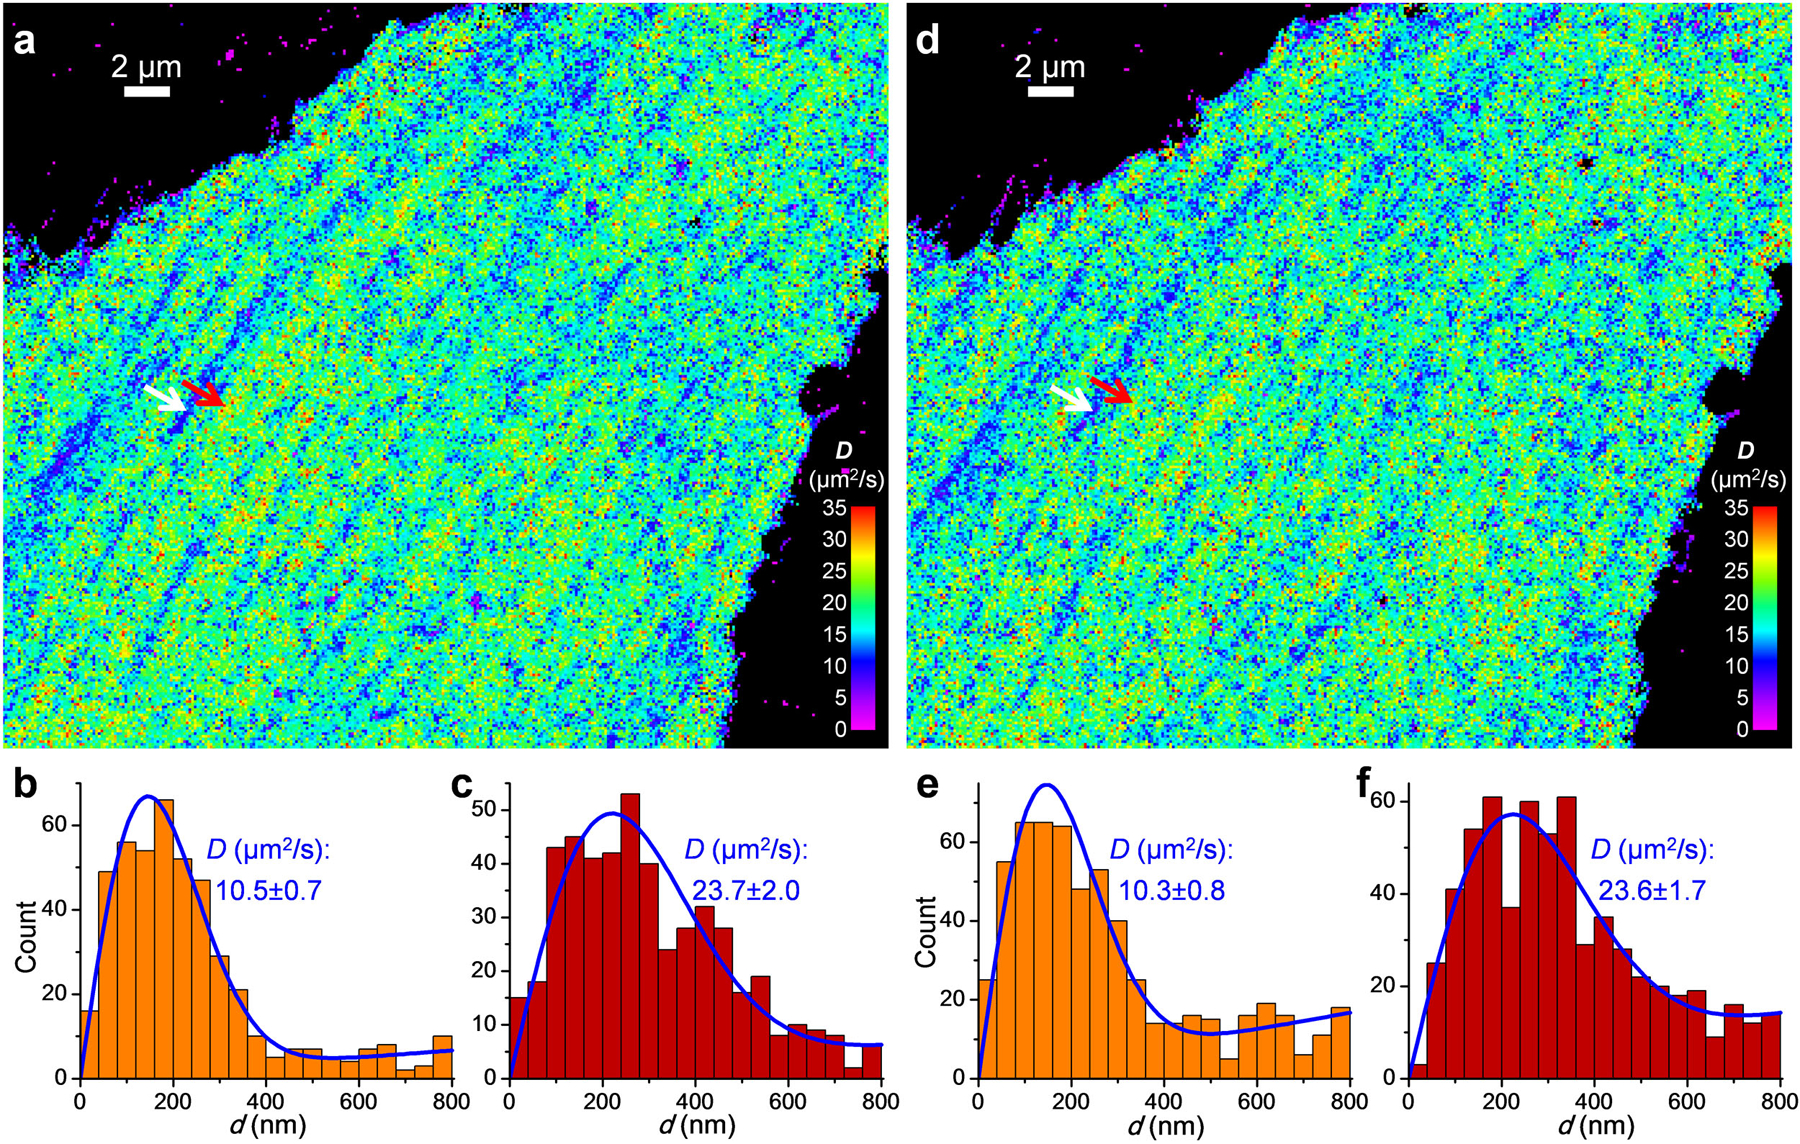
Extended Data Fig. 1. SMdM results at different single-molecule densities.

Free mEos3.2 was expressed in the cytoplasm of a PtK2 cell, and SMdM was performed on the same cell at a low single-molecule density of ~0.05 molecules/μm2/frame for 60,000 pairs of pulses (a-c), or at a high single-molecule density of ~0.11 molecules/μm2/frame for 30,000 pairs of pulses (d-f) by increasing the power of the photoactivation (405 nm) laser. (a) SMdM diffusivity map for the low single-molecule density experiment, obtained by spatially binning the single-molecule displacement d data onto 120×120 nm2 grids, and then individually fitting the distribution of d in each bin to eqn. 2 through MLE. (b,c) Distribution of 1-ms single-molecule displacement for two 360×360 nm2 areas inside (b; white arrow in a) and outside (c; red arrow in a) a linear structure of reduced local diffusivity, respectively. Blue lines are MLE results using eqn. 2, with resultant D and uncertainty σ labeled in each panel. (d-f) Results of the high single-molecule density experiment: comparable D values are obtained with the much-reduced number of pulse pairs, despite an increased background due to single-molecule mismatch. These experiments were independently repeated 10 times with similar results.
