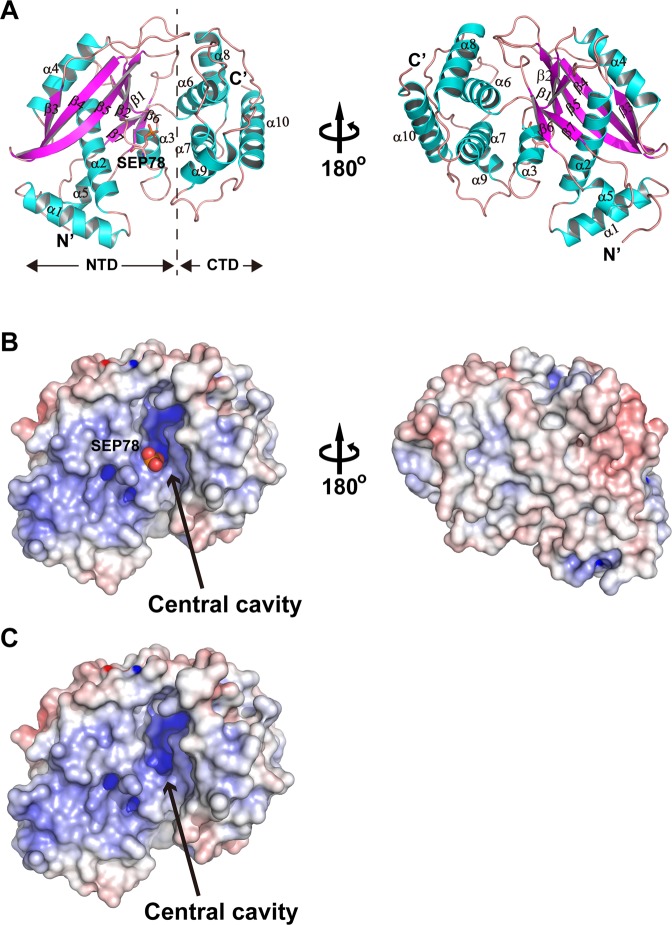
Fig. 2. The crystal structure of TlgT reveals a putative catalytic cavity.
a Ribbon model of the TglT crystal structure with annotated secondary structure elements. The phosphorylated S78 between NTD and CTD is highlighted with a stick model. Left, standard view; right, 180° rotation around the vertical axis. b Solvent accessible molecular surface of TglT colored by potential from −15 kT/e (red) to 9 kT/e (blue). The phosphate group (spheres) of SEP78 protrudes out of the left wall of the central cavity. Left, standard view; right, 180° rotation around the vertical axis. c Molecular surface of non-phosphorylated TglT with the same view and coloring scheme as panel b.

