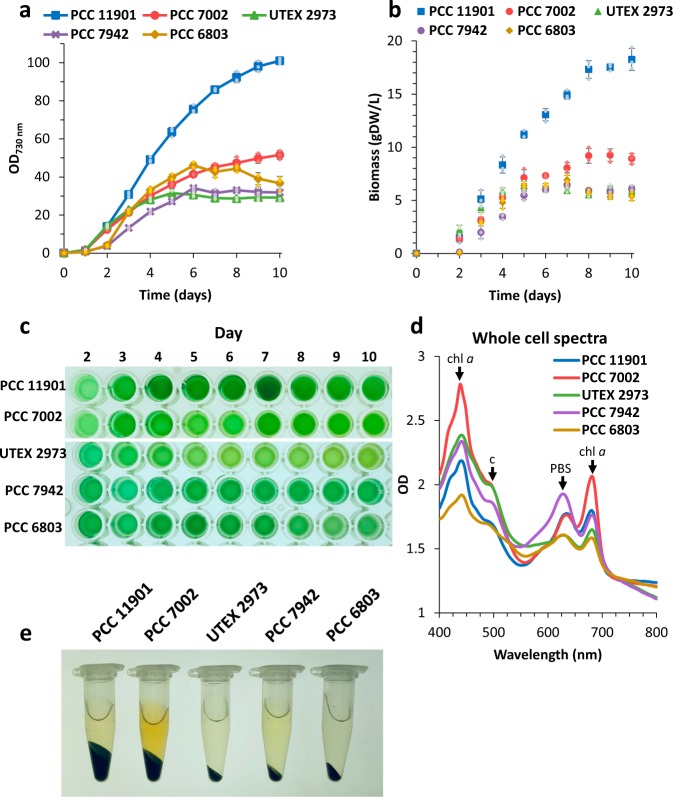
Fig. 6. Comparison of growth performance and biomass accumulation of commonly used cyanobacteria cultured in optimised media.
All strains were grown in triplicates at 30 °C, 200 rpm shaking under continuous illumination using RGB LED 1:1:1 ratio. Synechococcus sp. PCC 11901 and 7002 were grown in the MAD medium at initially 150 µmol photons m−2 s−1, which was then increased to 750 µmol photons m−2 s−1 after 1 day. Synechococcus elongatus UTEX 2973 was grown in 5xBG medium under the same conditions. Synechococcus elongatus sp. PCC 7942 and Synechocystis sp. PCC 6803 were also grown in 5xBG medium, with light intensity gradually increased from 75 to 150 µmol photons m−2 s−1 (day 1) and eventually set to 750 µmol photons m−2 s−1 (day 2). a, b Growth curve and biomass accumulation comparison of all tested cyanobacterial strains. c Culture samples over 10 days of cultivation. Samples were diluted to demonstrate pigmentation and are not representative of the actual culture cell densities. d Whole-cell spectra of cultures harvested after 10 days of cultivation and diluted to the same OD730. Highlighted peaks represent main absorption bands for: chlorophyll a (chl a) – λ = 440 and 680 nm, carotenoids (c) – λ = 490 nm and phycobilisomes (PBS) – λ = 620 nm. e Comparison of the cell pellet size from 1 mL of each culture harvested after 10 days of cultivation. Data points with error bars represent mean of n = 3 biological replicates ±standard deviation.

