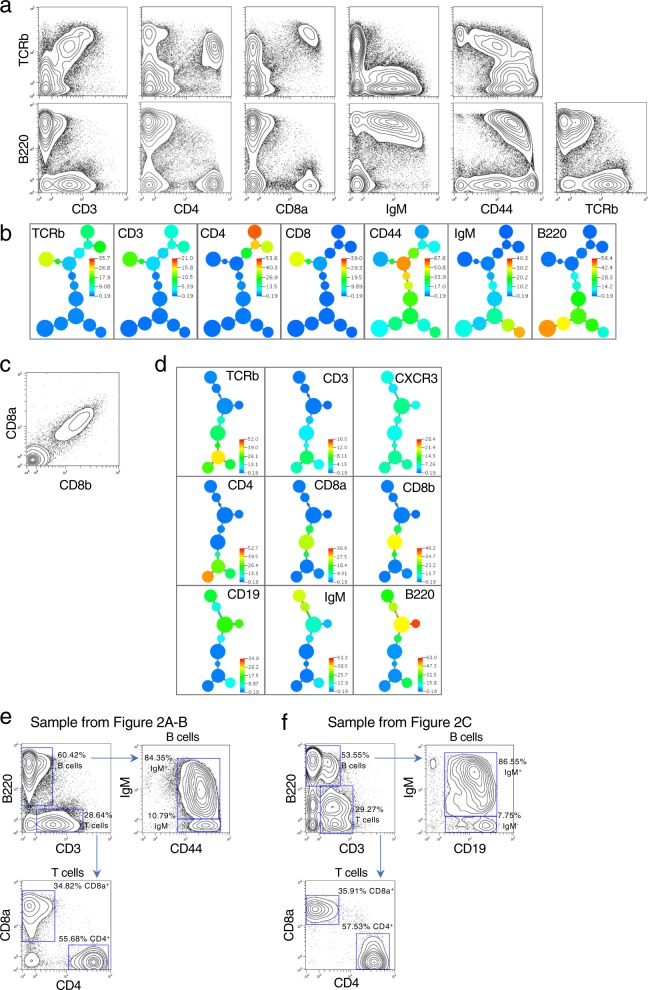
Fig. 2. Single-cell expression profiling of protein epitopes by quantum barcoding.
a Wildtype murine spleen cells were stained with seven antibodies. Sequence data was converted to an FCS file for display in 2D contour plots. In all, 63,870 cells were detected by the analysis and are represented in the plots. See Supplementary Figure 1 for biaxial plots for all markers. b An X-shift derived minimum spanning tree is shown for the data used in Fig. 2a. The tree is colored in a heatmap format per the marker shown in each panel. Appropriate co-expression of markers is seen for T cells (including a split for CD4 and CD8) as well as B cells. All seven markers were used in the clustering run. c Co-detection of epitopes on the CD8 heterodimer. Multiple antibodies (CD8a, CD8b, TCRb, CD4, CD3, B220, CD19, IgM, CXCR3) were used to stain murine splenic cells. Antibodies were used that are specific to two distinct epitopes present on the heterodimeric chains of CD8 (designated CD8a and CD8b). In all, 21,307 cells represented. The data displayed in a biaxial plot is unnormalized to highlight the correlation between the two CD8 subunits. Normalized biaxial plots of all markers are in Supplementary Fig. 2. d An X-shift driven minimum spanning tree is shown for the data in Fig. 2c for all the markers used in this staining. All nine markers were used in the clustering run. Data is normalized. e Phenotyping murine spleen cell populations by traditional bivariate gating. Two murine splenic cell samples shown in Fig. 2a–d were gated for T and B cell subsets. B cells were identified by the presence of B220 and T cells by the presence of CD3. Additional markers (IgM, CD44, CD19, CD8a, and CD4) were used to further subset the T and B cell populations. The two samples gated in this manner had comparable cell percentages by this gating strategy.

