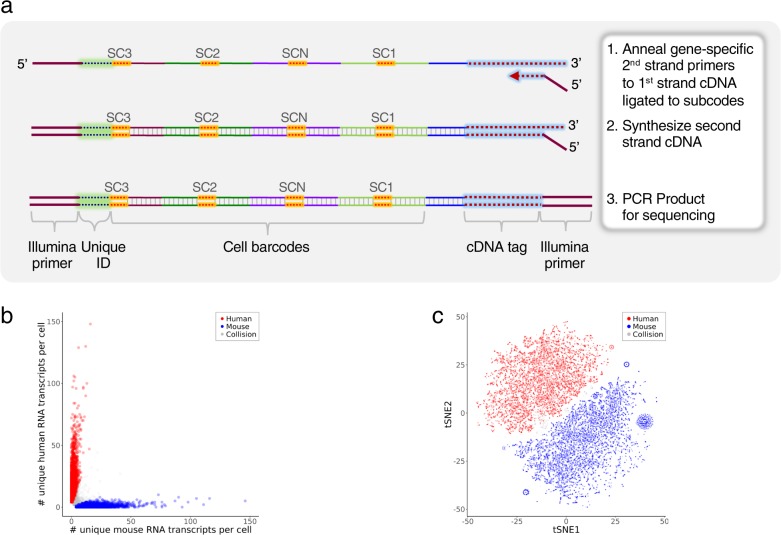
Fig. 7. Targeted mRNA QBC workflow.
a Schematic of targeted mRNA QBC workflow. Post lysis of cells analyzed for mRNA, a second sequence specific primer that contains the second Illumina primer sequence is used to synthesize the completed strand. The remaining mixture is PCR amplified for Illumina sequencing. b Single-cell expression of human and mouse transcripts in a 50:50 mixture of human Nalm6 and mouse BW5147 cells. RNAs targeted: ACTB, CD19, CD3E, CD4, CXCR4, HINT1, HSP90AB1, LAT, LCK, NAP1L1, OAZ1, PLCG1, PTPRC, ZAP70. The three cell aliquots sequenced had ~102, ~90, and ~38 M raw reads from which 25,610, 15,148, 12,499 cells were identified, respectively. Scatter plot of the number of unique RNA transcripts of each species type per cell for the 25,610 cell sample. Cells were color coded as human (red, 44%) or mouse (blue, 52%) if ≥75% of the total unique transcripts were from one of the species, otherwise the cells were labeled as collision (grey, 3.6%). Two outliers that had >150 unique transcripts per cell were not included in the plot. Two additional cell aliquots are shown in Supplementary Fig. 10a. c tSNE clustering of the mixture from Fig. 7b. Normalized data were visualized by t-SNE. Cells were colored as human (red), mouse (blue) and collision (gray) based on the cluster-assignment inferred from the number of unique RNA transcripts per cell as described in Fig. 7b. Two additional cell aliquots are shown Supplementary Fig. 10b.

