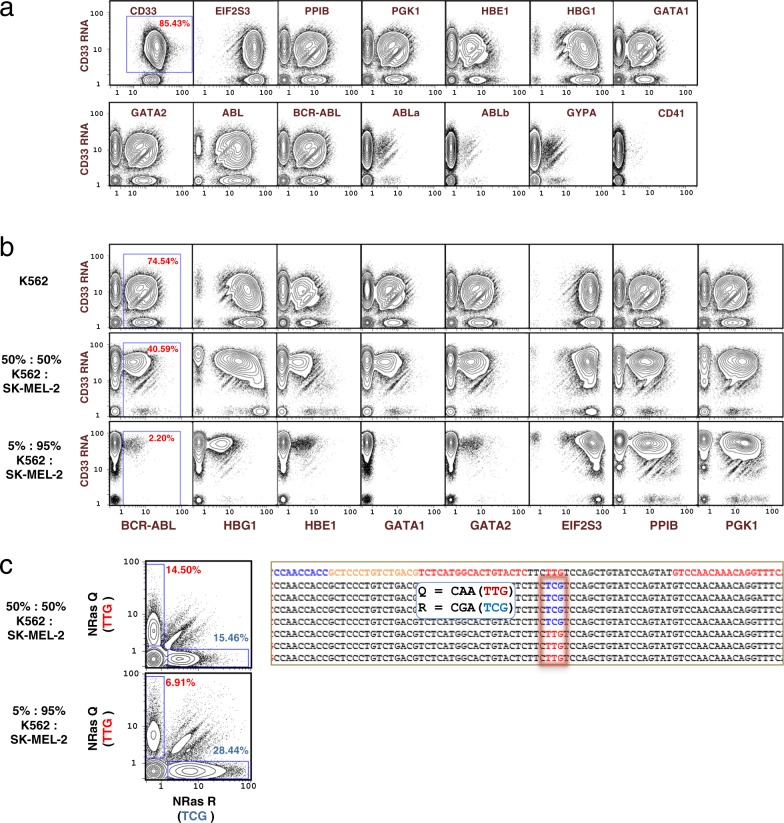
Fig. 9. Application of single-cell barcoding of targeted mRNA.
a Single-cell expression of 14 RNA transcripts by InsRT-QBC and 1 protein surface marker in K562 cells. BCR-ABL primers flank the fusion junction while ABLa and ABLb primers flank the non-fusion ABL isoforms at the fusion junction. ABL reverse transcription primers target transcript sequence downstream of the fusion junction. The library was sequenced on a HiSeq that yielded ~179 M reads for the sample from which 56,950 single cells were identified. CD33 protein expression level was much higher than any of the RNA target levels and was not included in the normalization of the RNA targets. The complete set of biaxial plots can be found in Supplementary Fig. 12. b Detection of RNA expression in cell mixtures. Comparison of 3 cell mixtures for single-cell expression of nine mRNA transcripts demonstrates differential expression between K562 cells and SK-MEL-2 for transcripts specific to blood cells (BCR-ABL, HBG1, HBE1, GATA1, GATA2) while expression from EIF2S3, PPIB, PGK1, and CD33 remains consistent between the mixtures. The BCR-ABL oncogene, is shown with the expected diminution when K562 cells were diluted with SK-MEL-2 cells. Plots represent 56,950 (K562), 54,085 (50:50 mixture), and 60,754 (5:95 mixture) cells. The complete set of biaxial plots can be found in Supplementary Figs. 12–14. c Distinct detection of NRAS SNP alleles by QBC. Mixtures of SK-MEL-2 cells and K562 cells were subjected to QBC. Plots of expression detected from the NRAS transcript at a known SNP location in the SK-MEL-2 cell line show largely mono-allelic expression at the locus, with a slight preference for expression of the R allele. Representative sequences are shown on the right where the wildtype Q allele at position 61 is shown as red (TTG) and the mutant R allele is shown as blue (TCG). The top line of the sequence represents a generic sequence for alignment. The flanking red sequences were the gene specific regions used in the primers. Plots represent 54,085 (50:50 mixture), and 60,754 (5:95 mixture) cells. The complete set of biaxial plots can be found in Supplementary Figs. 13 and 14.

