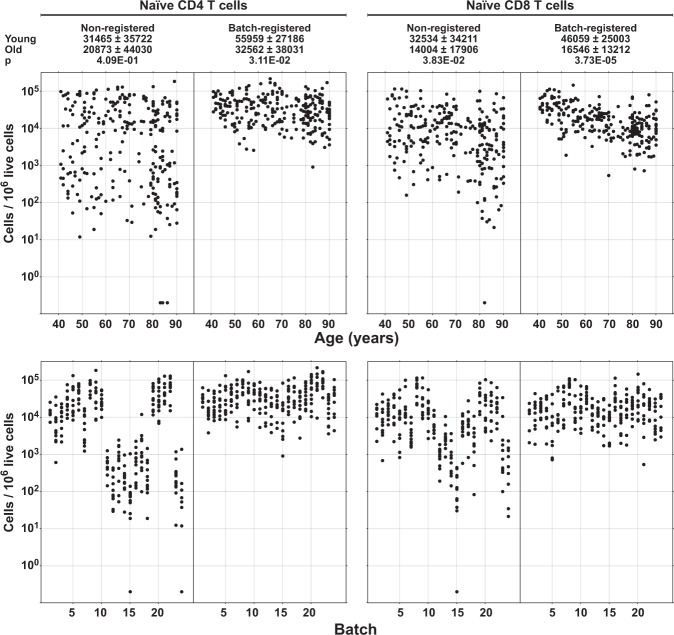
Fig. 9. Manual analysis of the registered data.
The registered and non-registered samples described in Fig. 7 were analyzed manually using a single set of gates without any algorithmic assistance. The same gates (Supplementary Fig. 6b) were used to analyze both registered and non-registered data. Each dot represents one subject. Subpopulation sizes are sorted by age or batch for naive CD4 T cells or naive CD8 T cells. p Values were derived from a two-sided Wilcoxon test of two subject groups (oldest vs. youngest) with n = 20 biologically independent samples per group.

