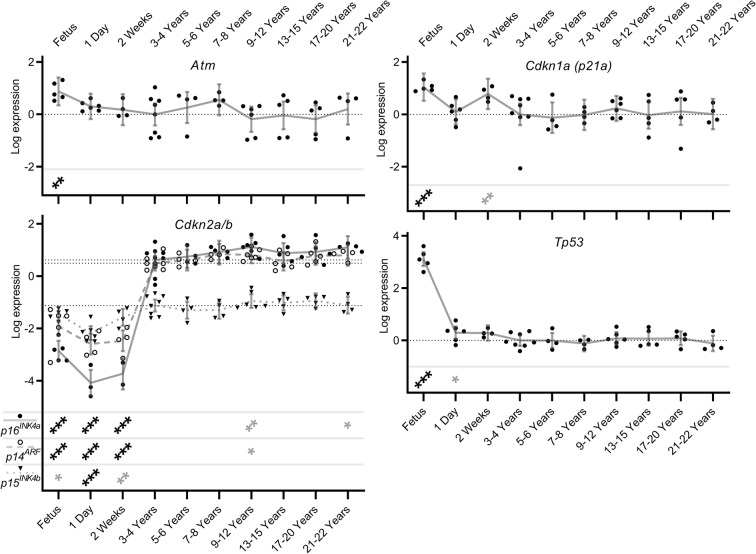
Fig. 5.
Senescence-related alternatively spliced isoform transcript expression levels in naked mole-rat brain during development and ageing. Shown here are transcript expression levels of senescence-related alternatively spliced isoform transcripts in NMR brain during development and ageing from foetus through to 20–22 years old. In order to show levels of individual isoform transcripts, expression levels are plotted relative to the median expression value of all isoforms across all time points within each gene. Data points represent β-coefficients of log fold-change in expression levels for each transcript in each animal relative to the mean expression of each isoform in the 3–4-year-old animals (null point for each isoform shown as a light dotted line). Grey lines denote the mean values with error bars at the 95% confidence intervals. Where applicable, isoform identities are shown in the legend at the lower left of the graph. Transcripts showing significant differences from the 3–4 year old comparator group are denoted with stars: * = p < 0.05, ** = p < 0.01, *** = p < 0.001. Associations which remain significant after FDR correction (p < 0.002) are indicated in black, while those in grey represent nominal associations (p < 0.05).

