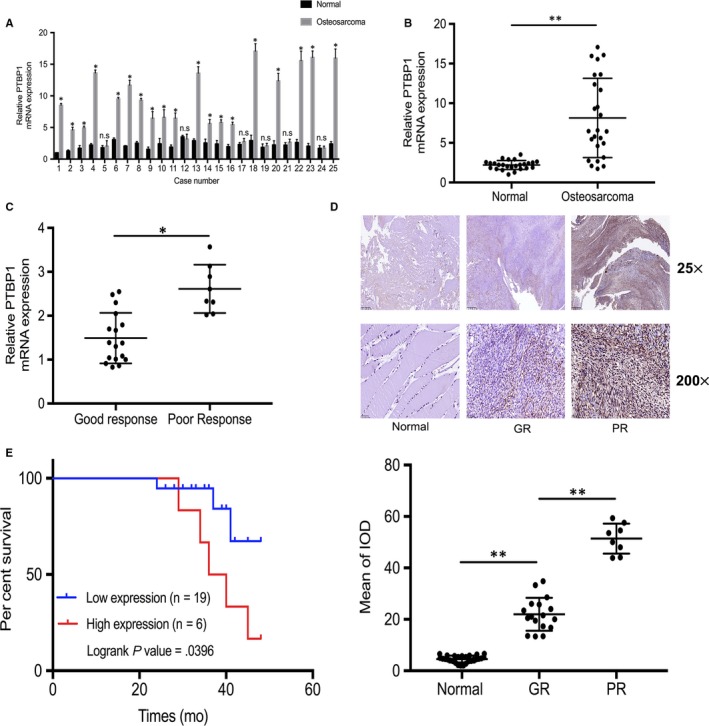
Figure 1.

PTBP1 up‐regulation is associated with poor response to chemotherapy and serves as a prognostic factor in osteosarcoma. A and B, Detection of PTBP1 expression in 25 pairs of osteosarcoma tissues and matched normal tissues by real‐time quantitative polymerase chain reaction (qRT‐PCR). C, In cases with poor response (PR) to chemotherapy and cases with good response (GR) to chemotherapy, PTBP1 mRNA level was measured by qRT‐PCR. D, PTBP1 expression in normal tissues, GR tissues and PR tissues was measured by immunohistochemistry (IHC). Scale bars: 500 μm (25×) and 50 μm (200×). IOD is integrated optical density. E, Kaplan‐Meier plot survival time in patients with low and high PTBP1 expression. *P < .05, **P < .01
