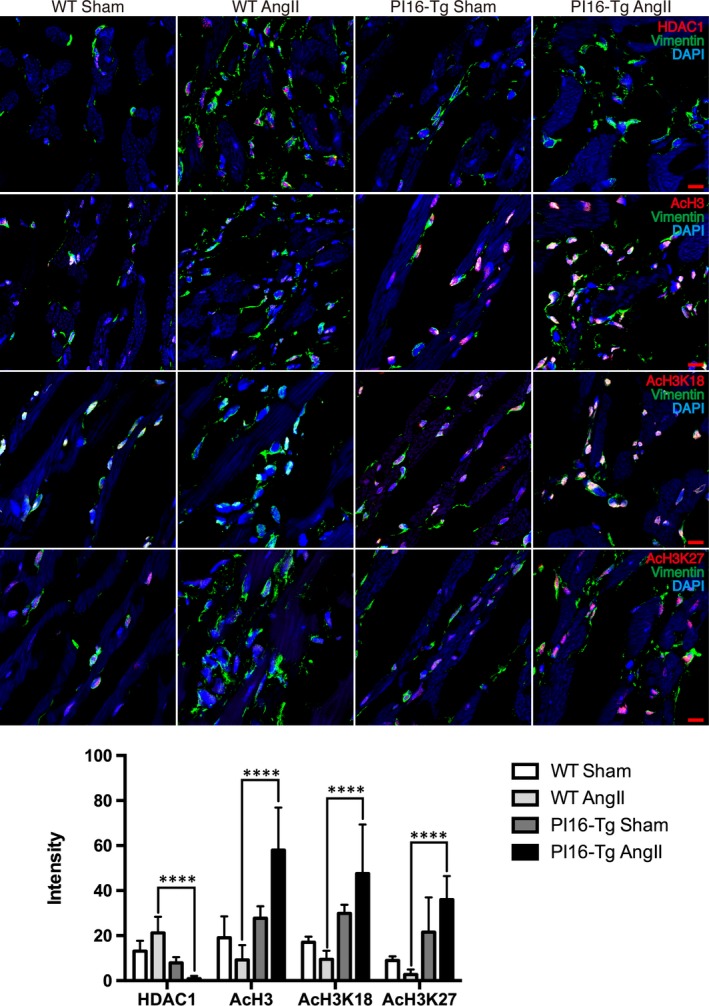
Figure 5.

The levels of HDAC1 and histone 3 acetylation in cardiac fibroblasts in vivo. Representative images of immunofluorescent staining and quantitation of HDAC1, AcH3, AcH3K18 and AcH3K27 (red) along with vimentin (green) from ventricular tissues of the indicated genotypes of mice after 4 weeks of angiotensin II treatment. Quantifications of positive cell intensity were normalized to total cells. Scale bar, 20 μm. Data are shown as the means ± standard errors of the mean of triplicates and are representative of three independent experiments performed. ****P < .0001
