Figure 2.

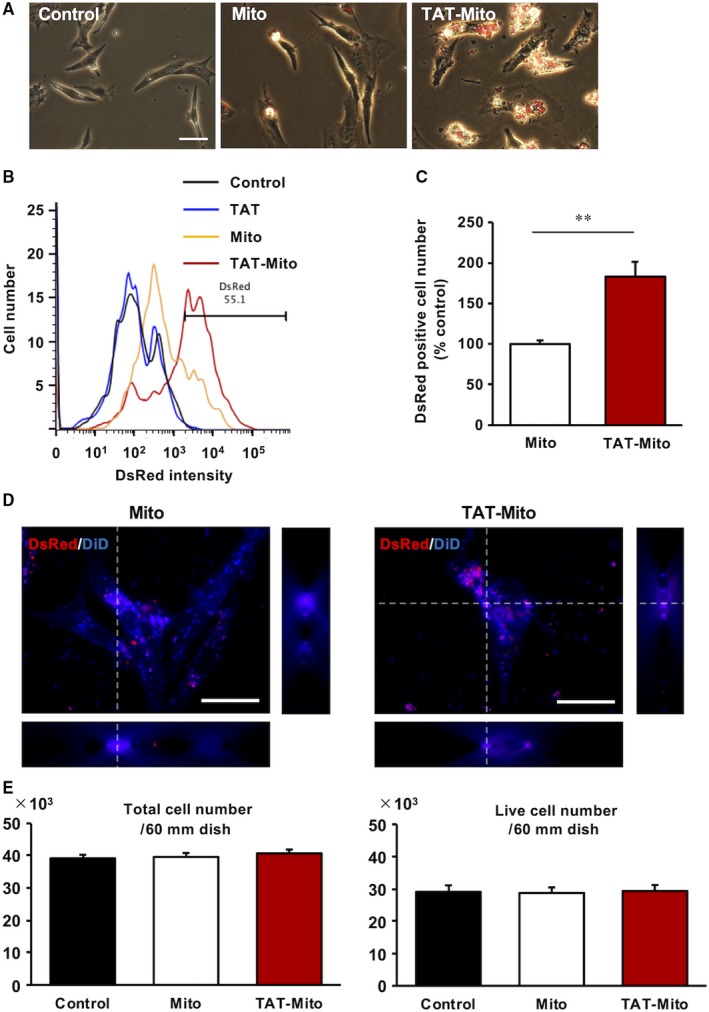
Transactivator of transcription‐dextran enhances cellular uptake of isolated mitochondria in NRCMs. (Recipient cells, NRCMs; Mitochondrial donor cells, H9c2 cells). A, Phase‐contrast microscopy images of NRCMs at 24 h after DsRed‐Mito transfer. The white bar indicates 100 µm. B, Evaluation of mitochondrial uptake by NRCMs based on DsRed intensity by flow cytometry. C, Graph representing rate of DsRed‐positive EMCs. Error bars indicate SE (n = 3). **indicates significant changes compared to mitochondrial transfer group (P < .01). D, 3D‐reconstructed images of NRCMs at 24 h after DsRed‐Mito transfer. The white bar indicates 25 µm. E, Cytotoxicity analysis of TAT‐dextran in NRCMs. Error bars indicate SE (n = 3)
