
Figure 1.
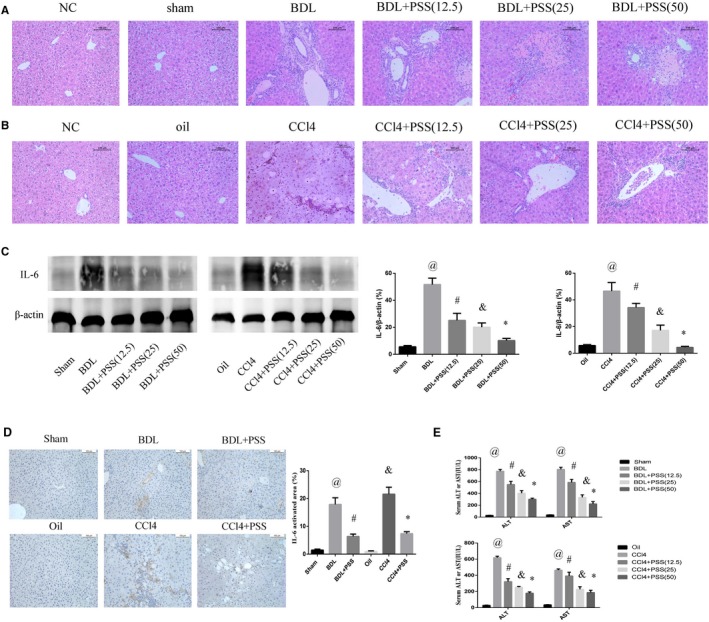
Protective effects of PSS on liver in BDL and CCl4 mouse models. A, HE staining of liver tissues in BDL experiment. Original magnification, 200×. B, HE staining of liver tissues in CCL4 experiment. Original magnification, 200×. C, IL‐6 protein expression was detected via Western blot. D, IHC staining of IL‐6 in liver tissues. We chose the PSS dose of 50 mg/kg as the representative dose in the subsequent experiment. Data were expressed as means ± SD (n = 8). @ P < .05 for BDL vs sham group, # P < .05 for BDL + PSS vs BDL group, & P < .05 for CCl4 vs oil group, *P < .05 for CCl4 + PSS vs CCl4 group. E, Suppression of serum ALT and AST levels. Above data are presented as means ± SD (n = 8). In BDL experiment, @ P < .05 for BDL vs sham group, # P < .05 for BDL + PSS (12.5) vs BDL group. & P < .05 for BDL + PSS (25) vs BDL group, *P < .05 for BDL + PSS (50) vs BDL group. In CCl4 experiment, @ P < .05 for CCl4 vs oil group, # P < .05 for CCl4 + PSS (12.5) vs CCl4 group. & P < .05 for CCl4 + PSS (25) vs CCl4 group, *P < .05 for CCl4 + PSS (50) vs CCl4 group