
FIGURE 3.
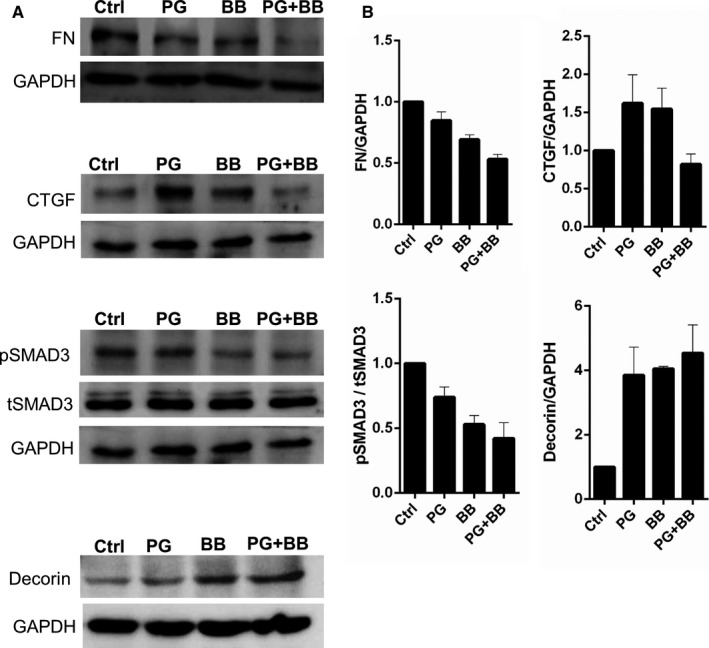
Protein validation of prostaglandin analogues or beta‐blockers alone and in combination on the differential gene expression of fibrosis‐associated genes in human trabecular meshwork cells in vitro. Panel A shows protein expression validation by immunoblotting for FN, CTGF, pSMAD3 (phosphorylated SMAD3), tSMAD3 (total SMAD3) and decorin following treatment of TM cells with IOP‐lowering medications for 24 h in vitro. The categories include untreated controls (Ctrl), prostaglandin analogue (PG), beta‐blocker (BB) or combination of prostaglandin analogue and beta‐blocker (PG+BB) treatments. GAPDH was used as protein loading controls. The blots shown are representative images of three independent experiments. Panel B exhibits quantification of protein expression of the immunoblot by densitometry analysis. The expression of the protein is indicated as ratio of respective protein to GAPDH (indicated in the y‐axis). The expression of pSMAD3 was quantified by normalizing its level to total SMAD3 expression (indicated in the y‐axis). Bar graphs represent the mean ± SEM of three independent experiments