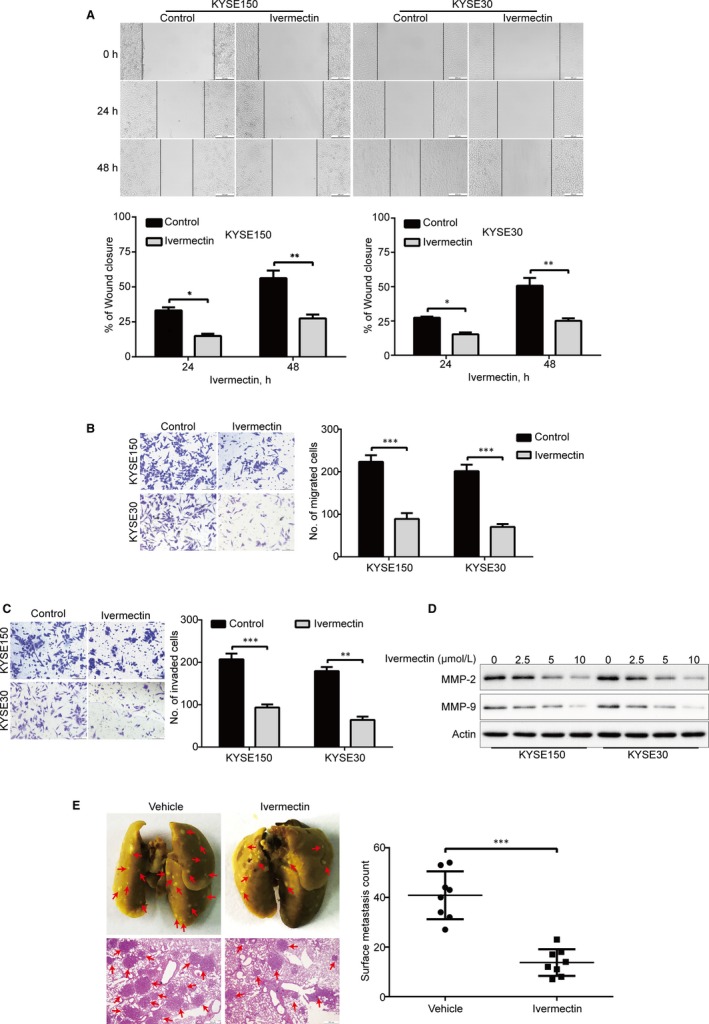
Figure 3.

Ivermectin suppresses migration, invasion and metastasis of ESCC cells. (A) KYSE150 and KYSE30 cells treated with or without 2.5 μmol/L ivermectin were subjected to wound healing assay. Top: Representative images were recorded at 0 h, 24 h, 48 h time‐point. Bottom: Quantitative analysis of the relative breadth of the wound from five independent experiments. The wound breadth was normalized to the initial time‐point (0 h). Columns and error bars represent mean ± SD (n = 5 per group). (B, C) KYSE150 and KYSE30 cells were pre‐treated with 2.5 μmol/L ivermectin for 48 h, and then subjected to transwell migration (B) and invasion (C) assays. Left: Representative images; Right: Quantitative analysis of five independent experiments. Scale bar: 100 μm. Mean; error bar, SD. (D) Western blotting analysis of whole cell lysates of KYSE150 and KYSE30 cells that were pre‐treated with different concentrations of ivermectin for 48 h. *P < .05, **P < .01, ***P < .001, by Student's t test. (E) KYSE150 cells were intravenously injected into nude mice via the lateral tail vein. Left: Representative images of lungs (upper panel) and lung sections stained with H&E (lower panel) harvested 8 weeks post‐injection (arrows indicate the metastatic tumours). Right: Surface metastatic nodules in the lungs were counted. Data represent mean ± SD (n = 8 per group). Scale bar, 200 μm. ***P < .001 by Student's t test
