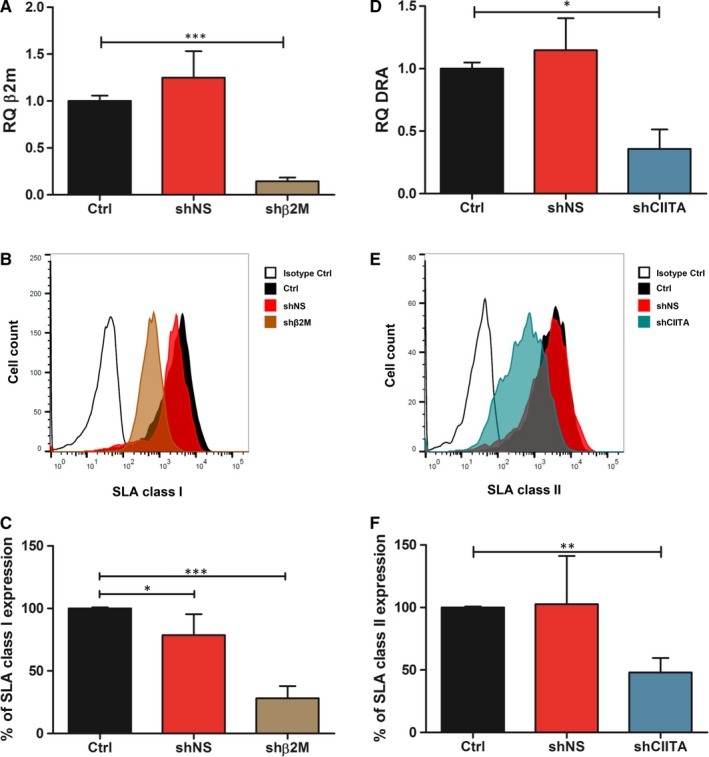
Figure 2.

Silencing SLA class I and class II expression in ICCs‐derived cells. A, Relative quantification (RQ) of β2M detected in shNS and shβ2M‐expressing ICC‐derived cells stimulated with interferon gamma (IFN‐γ) and tumour necrosis factor alpha (TNF‐α). B, Representative histogram plots of SLA class I expression on ICCs‐derived cells transduced with lentiviral vectors. NT ICCs‐derived cells or shNS cells were used as controls. C, Mean and standard deviations of percentages of SLA class I expression. D, RQ values of DRA transcript levels detected in shNS‐ and shCIITA‐expressing ICC‐derived cells stimulated with IFN‐γ and TNF‐α. E, Representative histogram plots of SLA class II expression. NT ICCs‐derived cells or shNS cells were used as controls. F, Mean and standard deviations of SLA class II expression levels. Percentage of expression was calculated by normalizing the MFI to those measured in the respective control sample. Transcript levels were normalized to the endogenous control gene GAPDH. Graph shows means and standard deviation of ≥4 independent assays. Statistical significance was calculated by using one‐way ANOVA followed by Tukey's post hoc test. *P < .05; **P < .01; ***P < .001
