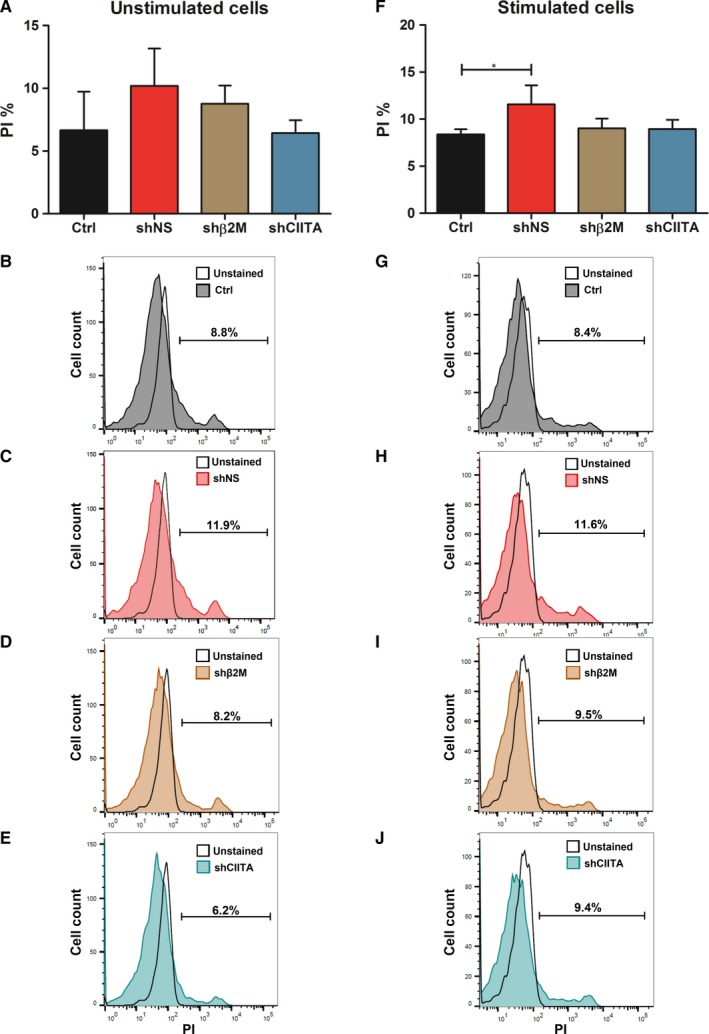
Figure 3.

Silencing SLA expression does not affect cell viability. A, Percentage of propidium iodide (PI)‐stained cells are displayed as mean and SD in the bar graphs without and F, with IFN‐γ and TNF‐α stimulation (*P < .05). B, Representative overlay histograms of PI‐stained control (Ctrl) cells, C, shNS‐expressing cells, D, shβ2M‐ and E, shCIITA‐silenced cells without stimulation with IFN‐γ and TNF‐α compared to unstained Ctrl cells. G, Representative histogram plots of PI‐stained Ctrl cells, H, shNS‐transduced cells, I, shβ2M‐ and J, shCIITA‐silenced cells stimulated with IFN‐γ and TNF‐α compared to the respective unstained control cells. Graphs depict means and standard deviations, n = 4. Statistical significance was calculated using one‐way ANOVA followed by Tukey's post hoc test. *P < .05
