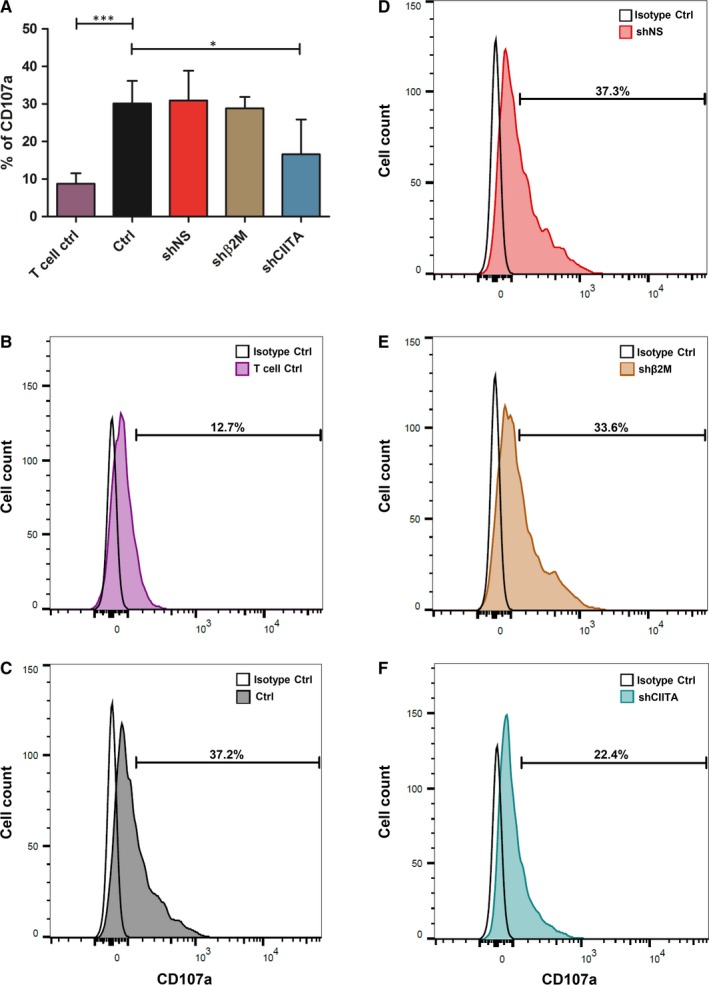
Figure 4.

Effect of SLA silencing in the T cell xenogeneic immune response. Primed T cells were co‐cultured with SLA‐silenced ICCs‐derived cells for 8 h, and T cell degranulation levels were measured by detecting CD107a expression. A, Bar graph shows means and standard deviations of CD107a expression determined by flow cytometry analysis. B, Representative overlay of spontaneous T cell degranulation (T cells only). C, Representative histogram plot of CD107a expression on T cells culture with Ctrl cells, D, shNS‐, E, shβ2M‐ and F, shCIITA‐silenced cells. Statistical significance was calculated using one‐way ANOVA followed by Tukey's post hoc test. *P < .05; ***P < .001
