FIGURE 4.

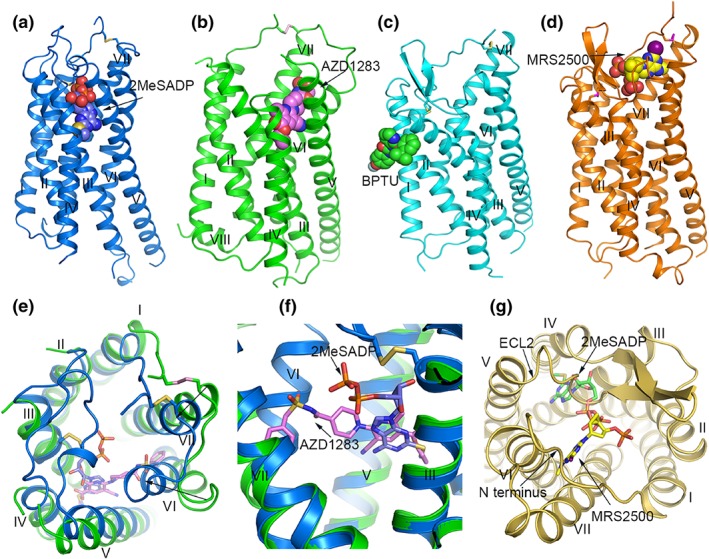
Structures of P2Y12 receptors and P2Y1 receptors. (a) Structure of the P2Y12 receptor‐2MeSADP 8 complex. The P2Y12 receptor is shown in blue cartoon representation. 2MeSADP is shown as blue spheres. The disulphide bonds are shown as yellow sticks. (b) Structure of the P2Y12 receptor‐AZD1283 40 complex. The receptor is coloured green and shown in cartoon representation. AZD1283 is shown as spheres with pink carbons. The disulphide bridge is shown as pink sticks. (c) Structure of the P2Y1 receptor‐BPTU complex. The P2Y1 receptor is coloured cyan and shown as cartoon. The ligand BPTU is shown as spheres with green carbons. The disulphide bonds are shown as yellow sticks. (d) Structure of the P2Y1 receptor‐MRS2500 10 complex. The P2Y1 receptor is shown in orange cartoon representation. MRS2500 is shown as spheres with yellow carbons. The disulphide bonds are show as magenta sticks. (e) Structural comparison of the extracellular region in the P2Y12 receptor‐2MeSADP and P2Y12 receptor‐AZD1283 complexes. In the P2Y12 receptor‐AZD1283 structure, the receptor is shown in green cartoon representation, the ligand AZD1283 is shown as pink sticks. In the P2Y12 receptor‐2MeSADP structure, the receptor is shown in blue cartoon representation and 2MeSADP is shown as blue sticks. The black arrows indicate the movements of helices VI and VII in the 2MeSADP‐bound structure relative to the AZD1283‐bound structure. (f) Comparison of the binding pose of AZD1283 and 2MeSADP in P2Y12 receptors. The colour scheme is the same as that in panel (e). (g) Comparison of the nucleotide binding modes in P2Y1 receptors and P2Y12 receptors. The P2Y1 receptor is shown in yellow cartoon representation. MRS2500 and 2MeSADP are shown as yellow sticks and green carbon respectively
