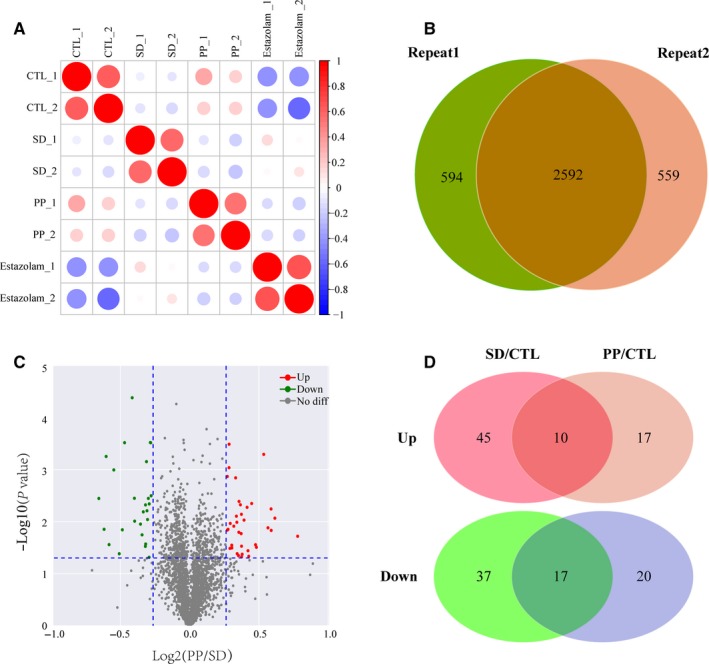
Figure 3.

Result overview of differential proteomics based on LC‐MS/MS analysis. A, Repeatability analysis of quantification proteins of two replications. Pearson's correlation coefficient was used for the repeatability analysis. B, Venn diagram of protein identification between each replication. C, DEP screening uses a volcano plots with the threshold of fold change >1.2 or <1/1.2 and P‐value <.05. D, Venn diagram showing that 10 up‐regulated and 17 down‐regulated proteins in SD/CTL and PP/CTL overlap
