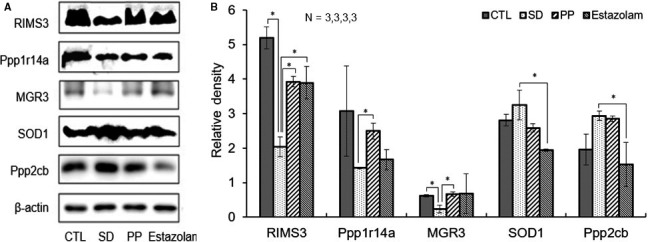
Figure 5.

Validation of five differentially expressed proteins in CTL and treatment groups. A, RIMS3, Ppp1r14a, MGR3, SOD1, Ppp2cb and β‐actin bands, respectively, expressed from rat groups of CTL, SD, PP and estazolam. B, The relative density of the validated proteins was normalized with β‐actin as the internal reference. One‐way ANOVA, n = 3, *P < .05
