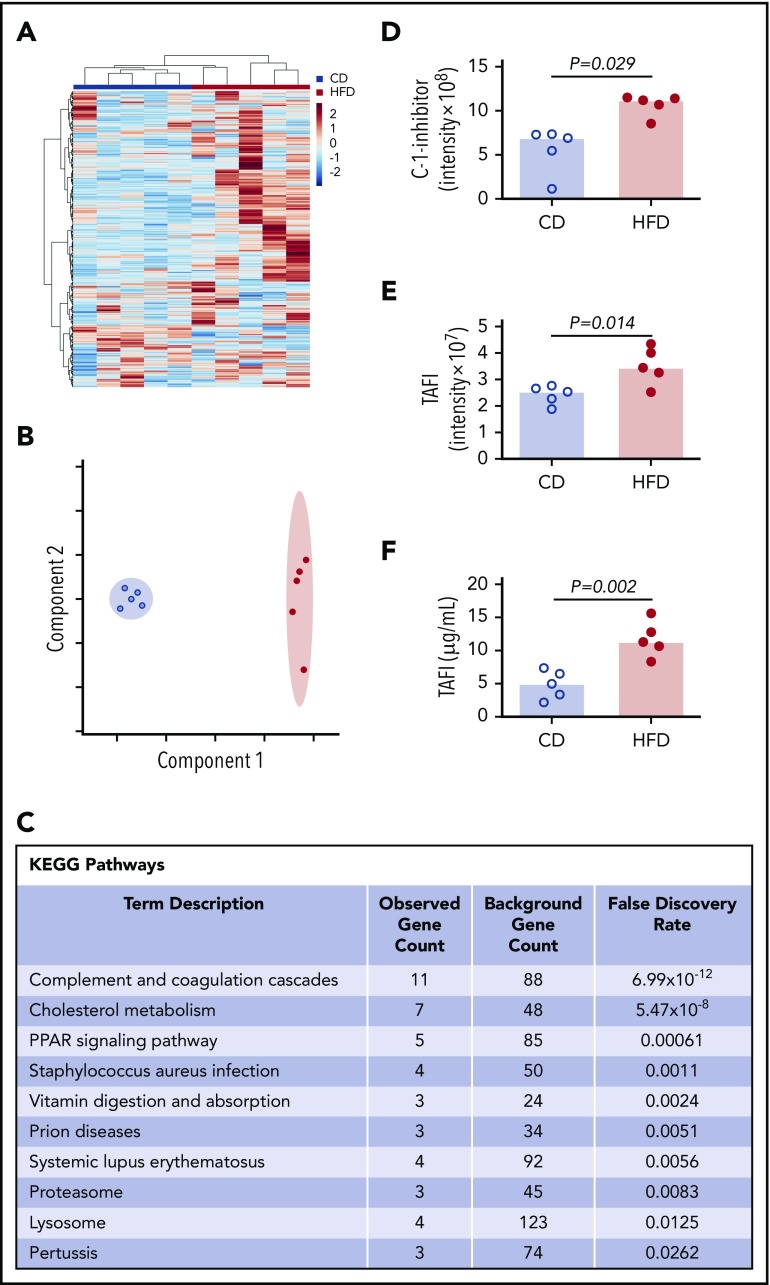
Figure 5.
Mass spectrometry detects altered concentrations of coagulation and fibrinolytic proteins in plasma. (A) Heat map with Ward clustering of protein relative abundances (Z-scored). (B) Partial least squares discriminant analysis data reduction based on relative abundances of plasma proteins from (blue circles) CD- and (red circles) HFD-fed mice. (C) Enrichment of functional pathways in HFD-fed mice by Kyoto Encyclopedia of Genes and Genomes analysis. (D-E) Relative C-1-inhibitor and TAFI levels in CD- and HFD-fed mice determined by mass spectrometry. Intensity measurements are area under the curve for all peptides originating from the listed protein. (F) TAFI concentrations determined by ELISA. Bars indicate medians. Each dot represents a separate mouse.

