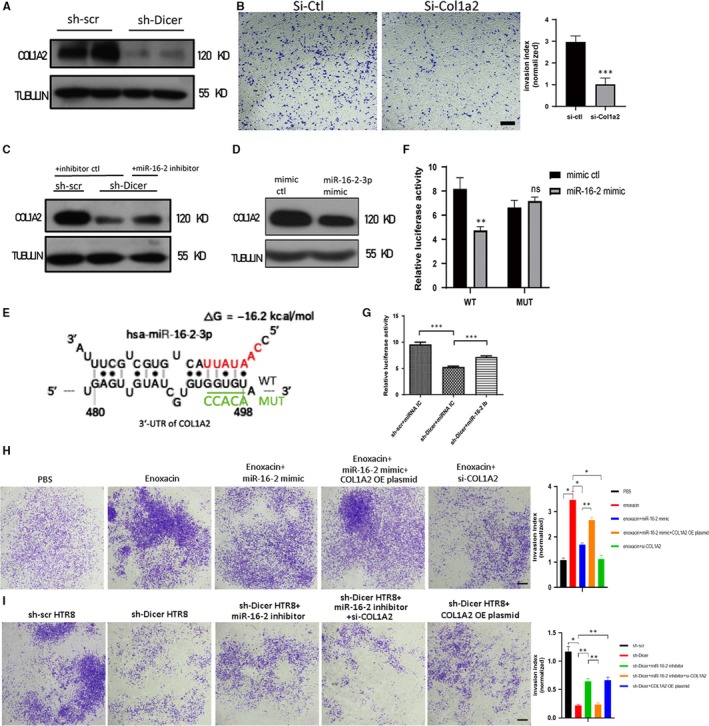
Figure 3.

COL1A2 is a target of miR‐16‐2‐3p and mediates the impaired invasion of sh‐Dicer HTR8 cells. A, Representative immunoblot of COL1A2 in sh‐scr and sh‐Dicer HTR8 cells. TUBULIN was blotted as loading control. B, Invasion assay of HTR8 cells transfected with si‐ctl or si‐Col1a2 RNA (left). Scale bar = 200 µm. Quantification of cell number at the outside membrane of transwell insert (right). The mean ± SEM is shown. ***P < .001 (n = 3). C, Representative immunoblot of COL1A2 in sh‐scr HTR8 cells transfected with miRNA inhibitor ctl and sh‐Dicer HTR8 cells transfected with inhibitor ctl or miR‐16‐2‐3p inhibitor. TUBULIN was blotted as loading control. D, Representative immunoblot of COL1A2 in HTR8 cells transfected with miRNA mimic ctl or miR‐16‐2‐3p mimic. TUBULIN was blotted as loading control. E, Schematic diagram shows one predicted binding site of miR‐16‐2‐3p on the wild‐type 3′‐UTR of COL1A2 (WT) where red bases in miR‐16‐2‐3p represent its seed region. Five bases underlined by green line in WT are changed into five other bases shown in green colour and referred as to MUT. F, Relative luciferase activity (firefly luminescence/Renilla luminescence) of HTR8 cells 48 h after transfection of psiCHECK‐2 vector with the COL1A2 WT or MUT 3′‐UTR insert. miR‐16‐2 mimic or mimic ctl is transfected into HTR8 cells 24 h before luciferase activity is measured. The mean ± SEM is shown. **P < .001, ns, non‐significant (n = 3). G, Relative luciferase activity (firefly luminescence/Renilla luminescence) of sh‐Dicer or sh‐scr HTR8 cells 48 h after psiCHECK‐2 vector with the COL1A2 WT 3′‐UTR insert is transfected. miR‐16‐2 inhibitor or inhibitor control is transfected into sh‐Dicer HTR8 cells or sh‐scr HTR8 cells 24 h before luciferase activity is measured. The mean ± SEM is shown. ***P < .001 (n = 3). H, Invasion assay of HTR8 cells treated with enoxacin or transfected with miR‐16‐2‐3p mimic or si‐Col1a2 RNA or COL1A2 overexpression plasmid. Scale bar = 200 µm. Quantification of cell number at the outside membrane of transwell insert (right). The mean ± SEM is shown. *P < .05, **P < .01 (n = 3). I, Invasion assay of sh‐scr HTR8 cells and sh‐Dicer HTR8 cells transfected with miR‐16‐2‐3p inhibitor or si‐Col1a2 RNA or COL1A2 overexpression plasmid. Scale bar = 200 µm. Quantification of cell number at the outside membrane of transwell insert (right). The mean ± SEM is shown. *P < .05, **P < .01 (n = 3)
