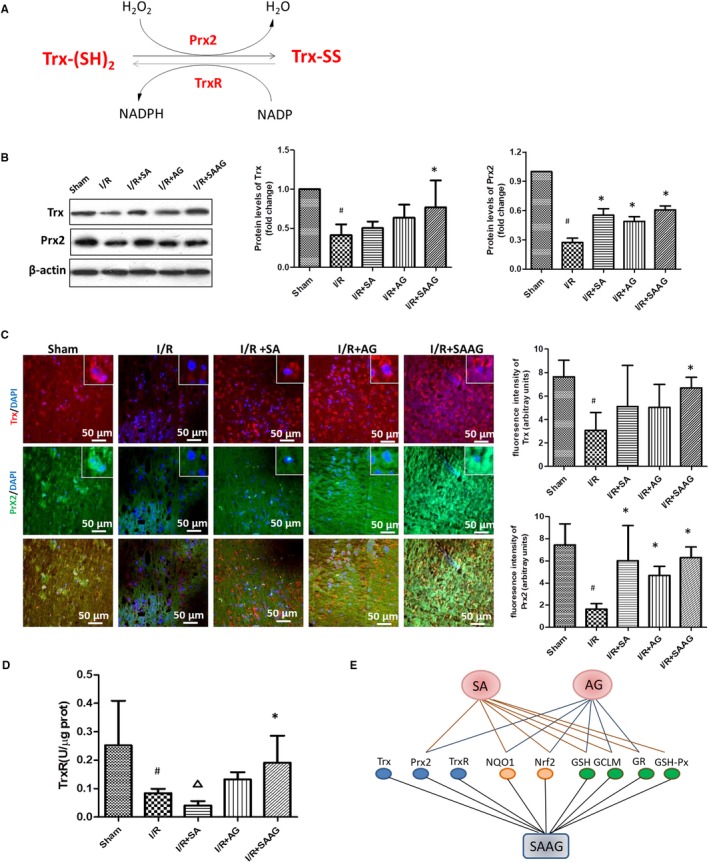
Figure 3.

SAAG and its two components, SA and AG, enhanced the Trx system and a schematic diagram summarizing the effect of SAAG and its two components on the functions of the GSH, Nrf2 and GSH systems. A, Schematic diagram illustrating the Trx systems which includes Trx, Prxs, TrxR and NADPH (the molecules labelled red were detected molecules); B, Western blotting of Trx and Prx2 and their quantitation (n = 3). C, Immunofluorescence staining for Prx2 (green), Trx (red) and their quantitation of fluorescence intensity (arbitrary units, n = 3‐5 animals per group); nuclei (blue), scale bar: 50 μm. D, TrxR activity (n = 6); # P < .05 compared with the sham group, *P < .05 compared with the I/R group, and ∆ P < .05 compared with the I/R + SAAG group. E, Schematic diagram summarizing the effects of SAAG, SA and AG on the functions of the GSH, Nrf2 and GSH systems. Trx systems include Trx, Prx2 and TrxR, as indicated by blue dots; Nrf2 systems include NQO1 and Nrf2, as indicated by orange dots, while GSH systems include GSH, GCLM and GR, as indicated by green dots. The line between SAAG, SA and AG and the biomolecules of these systems represents the significance that was observed by experiments when compared with the I/R group
