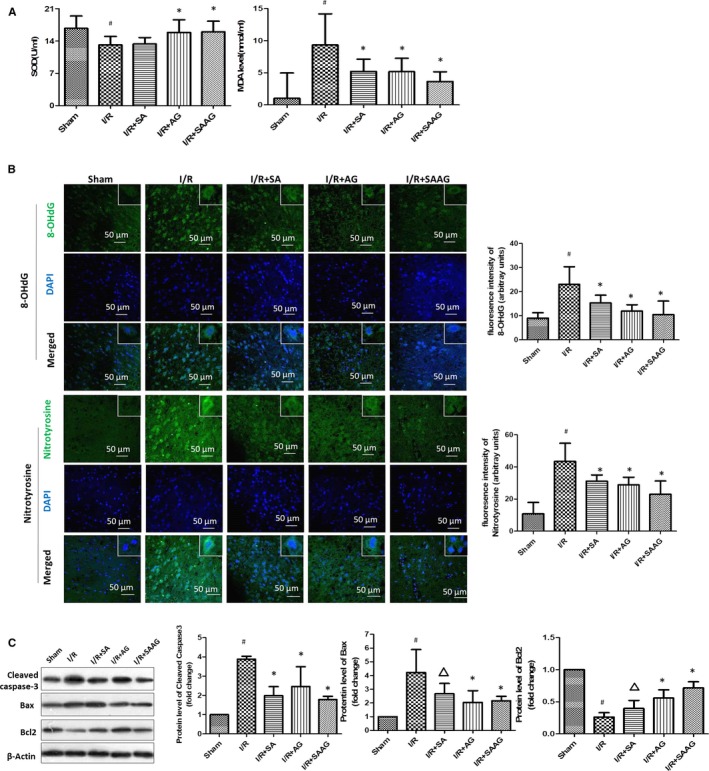
Figure 5.

SAAG, SA and AG inhibited apoptosis and oxidative damage. A, The serum SOD activity and MDA content (n = 6). B, Immunofluorescence staining for 8‐OHdG (green), nitrotyrosine (green) and their quantitation of fluorescence intensity (arbitrary units, n = 3‐5 animals per group); nuclei (blue), scale bar: 50 μm. C, Western blotting of cleaved caspase‐3, Bax and Bcl2 levels and their quantitation (n = 3); # P < .05 compared with the sham group, *P < .05 compared with the I/R group, and ∆ P < .05 compared with the I/R + SAAG group
