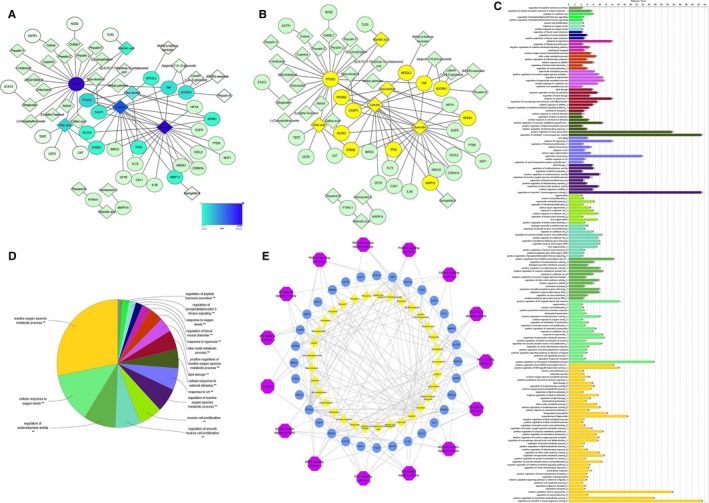
FIGURE 1.

Network pharmacology analysis of PAF. A, Establishment of compound‐target network of PAF. A compound and a target linked if the target protein was hit by the corresponding compound. Node colour is relative to its degree (the darker the colour, the greater the degree). B, The core network of anti‐ALI in PAF. Core targets and compounds are filled with yellow. C, Target‐pathway‐biological process association chart. The different colours indicate the different biological functions or metabolic pathways, and the longer the band, the greater the relevance of the targets to the pathway. D, ClueGO analysis of the candidate targets. The node pie charts represent the molecular function and reactome analysis of these targets. E, Compound‐target‐pathway network
