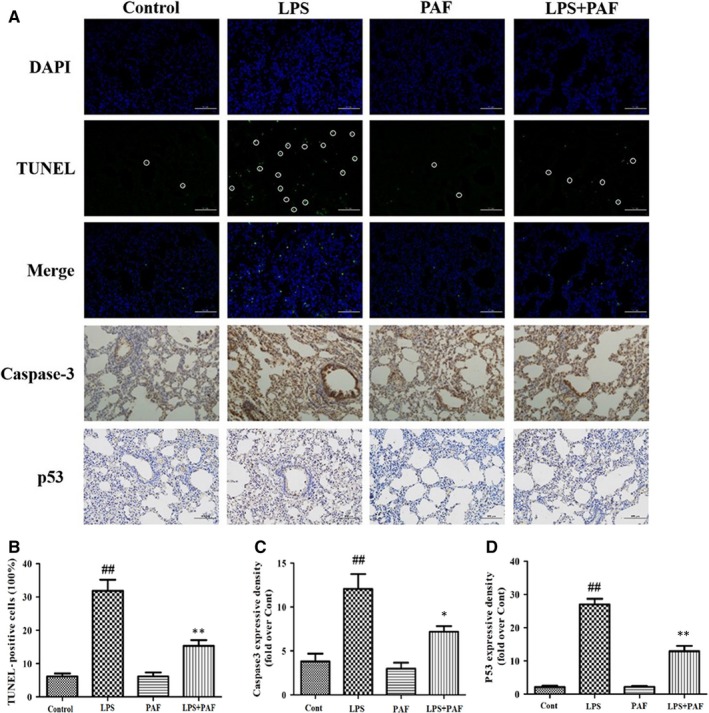
FIGURE 3.

Apoptosis detection of LPS‐induced ALI lung injury. A, From top to bottom: DAPI staining, TUNEL staining, immunohistochemistry staining of caspase‐3 and p53 protein (magnification 200×). B, TUNEL staining result, n = 3. C, Representative images of caspase‐3 protein level in lung determined by immunohistochemistry, n = 3. D, Representative images of p53 protein level in lung determined by immunohistochemistry, n = 3. The values represent the means ± SD. ## P < .01 vs the control group; *P < .05, **P < .01 vs the LPS group
