
Figure 3.
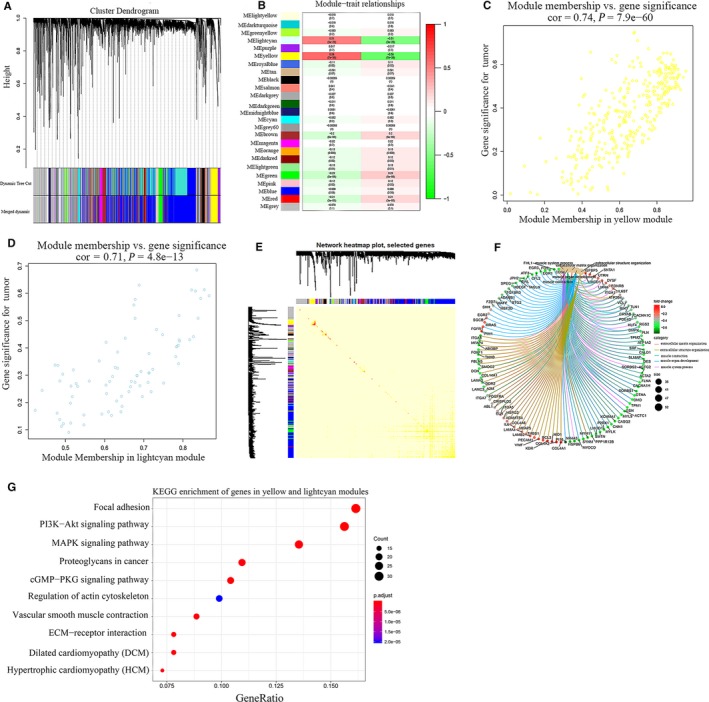
Analysis of key modules highly related to traits. A, Cluster dendrogram of genes with top 60% variances in the co‐expression network. B, The correlation between modules and traits was displayed, and the ME of the yellow and lightcyan modules are most positively related to traits. C‐D, The correlation between GS and MM in the lightcyan and yellow modules. E, TOM plot of selected genes. Modules are sorted by cluster dendrogram. Red colour represents high topological overlap and light colour represents lower overlap. This TOM plot showed that there is no high topological overlap among 25 modules, indicating that the modules have a high degree of scale independence. F, GO‐GSEA showed the linkages of genes and BP. G, KEGG showed the pathway enrichment of genes in yellow and lightcyan modules