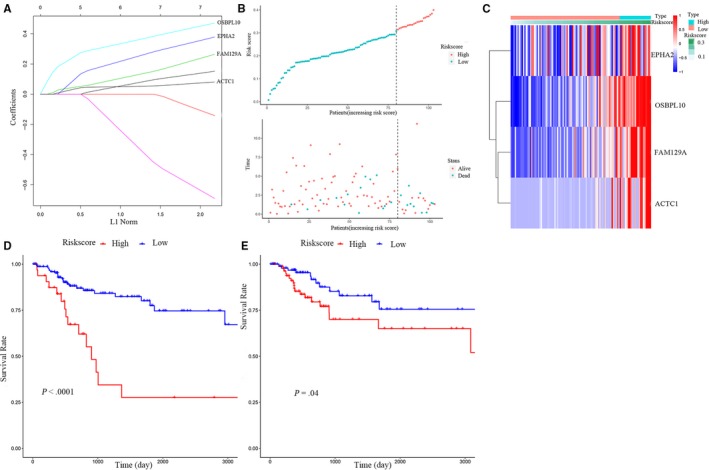
Figure 6.

Construction of the 4‐gene‐based prognostic model. A, LASSO coefficient profiles of the 4 survival‐related RNAs. B, BC patients were divided into high‐risk and low‐risk groups. C, The expression heatmap of the 4 genes between high‐risk and low‐risk group. D‐E, Kaplan‐Meier survival curve of OS and DFS in the whole set
