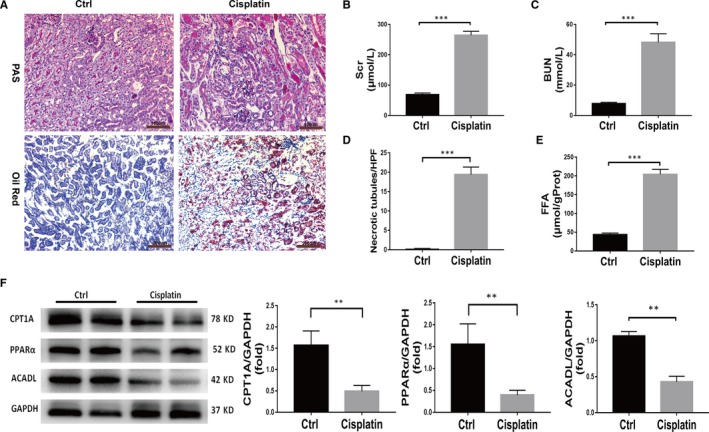
Figure 1.

Mice with cisplatin‐induced AKI exhibit fatty acid oxidation dysfunction and lipid deposition. A, PAS staining (scale bar, 100 µm) and oil red O staining (scale bar, 200 µm) of kidney tissue from wild‐type (WT) mice in the control group and the cisplatin group. B, Comparison of serum creatinine (Scr) levels between the control and cisplatin‐treated WT mice, n = 6, ***P < .001. C, Comparison of blood urea nitrogen (BUN) levels between the control and cisplatin‐treated WT mice, n = 6, ***P < .001. D, Quantitative analysis of necrotic tubules. Data are the mean ± SD of 20 random fields from each kidney, ***P < .001, n = 3. E, Comparison of the FFA concentrations in the control and cisplatin‐treated WT mice, n = 6, ***P < .001. F, Western blot and densitometric analysis of key fatty acid oxidation proteins in the kidney tissue of mice in the control group and cisplatin group, n = 4, **P < .01
