Figure 2.

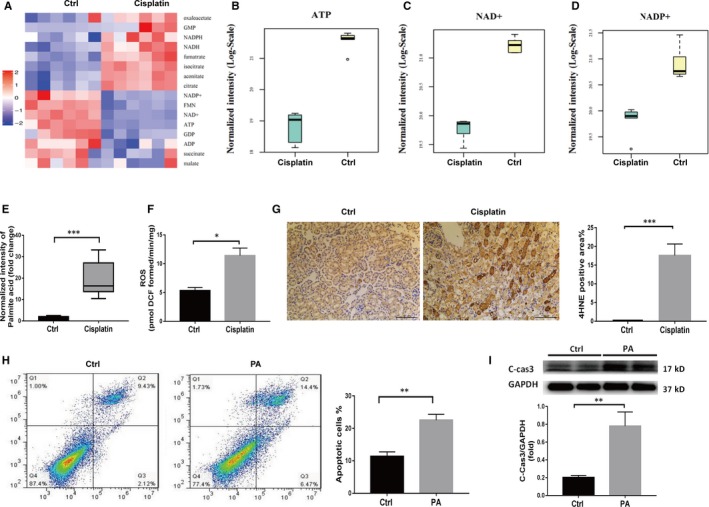
Metabolic disorders and FFA‐related lipotoxicity increase the apoptosis of mRTEcs. A, Metabolomics analysis of the kidney cortex in the control group and the cisplatin group. Heat map showing the relative levels of metabolites in kidneys from mice in each group (n = 6). B‐D, LC‐MS detection of ATP, NAD+, NADP+ in the kidney cortex of mice in the control group and the cisplatin group, n = 6, *P < .05. E, LC‐MS detection of palmitic acid level in the kidney of mice in the control group and the cisplatin group, n = 6, ***P < .001. F, Comparison of ROS between the control and cisplatin‐treated WT mice, n = 3, *P < .05. G, Representative 4HNE immunohistochemical staining of mouse kidney sections from the control group and the cisplatin group and the semiquantitative positive 4HNE staining scores, scale bar, 100 µm. H, The apoptotic rates of mRTEcs in the control group and the palmitic acid group were detected by V‐FITC/PI staining, **P < .01, n = 3. I, Western blot and densitometric analysis of cleaved caspase‐3 in mRTEcs in the control group and the palmitic acid group, **P < .01, n = 4
