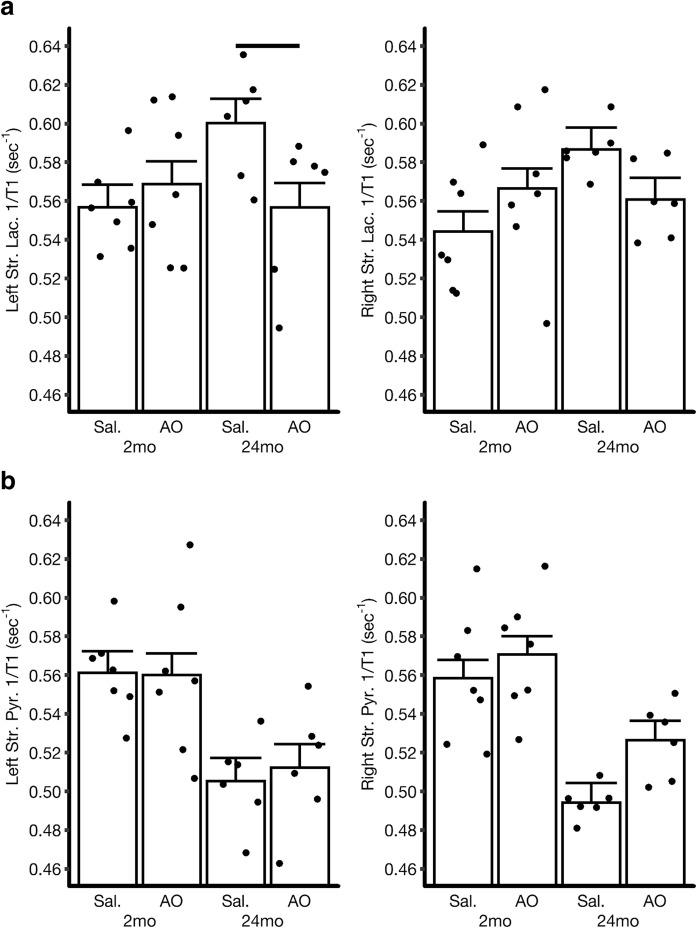
Fig. 4.
Modeled R1 mean a left and right stratum lacunosum (Str. Lac.) or b stratum pyramidale (Str. Pyr.) (illustrated in Fig. 2) for different B6NIA groups aged either 2 months (left two bars) or 24 months (right two bars) from QUEST MRI scans of urethane-anesthetized mice. The number of animals in each group is presented in Table 1. Averages of R1 for each mouse are shown by circles. Error bars: SEM. Please note that the SEMs shown are based on a statistical modeling of the data. As such, the SEM is similar across groups. Reductions in R1 with anti-oxidants are considered to be an index of oxidative stress and significant changes are indicted with a horizontal black bar (P < 0.05)

