Fig. 3.
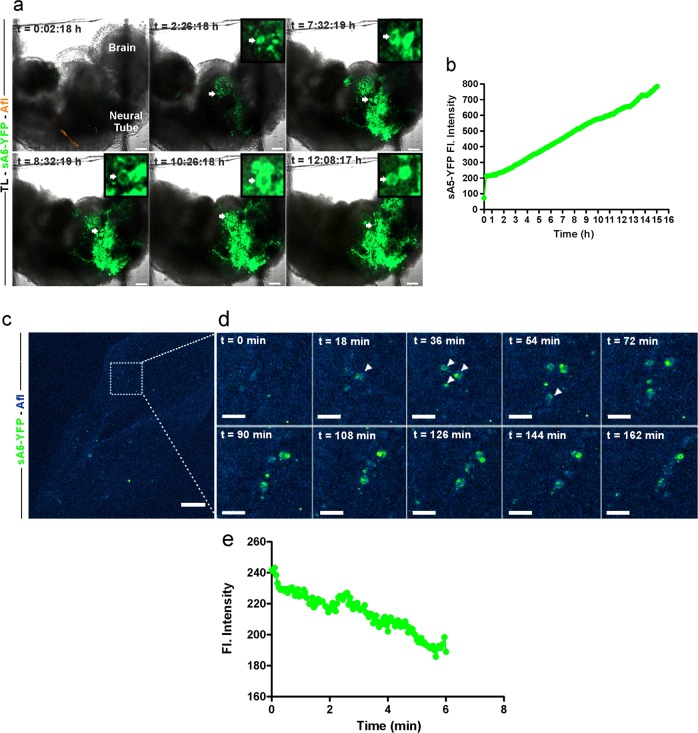
Time-lapse microscopy of PCD in a sA5-YFP embryo and during cranial neural tube closure. a Tracking of PCD events in an E8.75 sA5-YFP embryo upon induction of massive cell death by medium starvation (one frame every 5 min over 15 h, z-stack with 4 µm slices; images depicted are from slice #17, boxed images are close-ups from regions with arrows). After 2 h, sA5-YFP+ rounded cells (white arrows) appeared. b Fluorescence intensity from a over time. c, d Time-lapse microscopy of the brain of an E8 sA5-YFP embryo: the area marked with a white box in a is magnified in the subsequent pictures in d. After 18 min, the first rounded sA5-YFP+ cells (white arrows) appeared; notice that these cells stayed (dancing like) in this area without being engulfed for about 6 h. e Quantitation of sA5-YFP fluorescence signals from d over time. sA5-YFP secreted human Annexin V-yellow fluorescent protein, TL transmission light, and Afl autofluorescence. Bars are 100 μm (a, c) and 40 μm (d)

