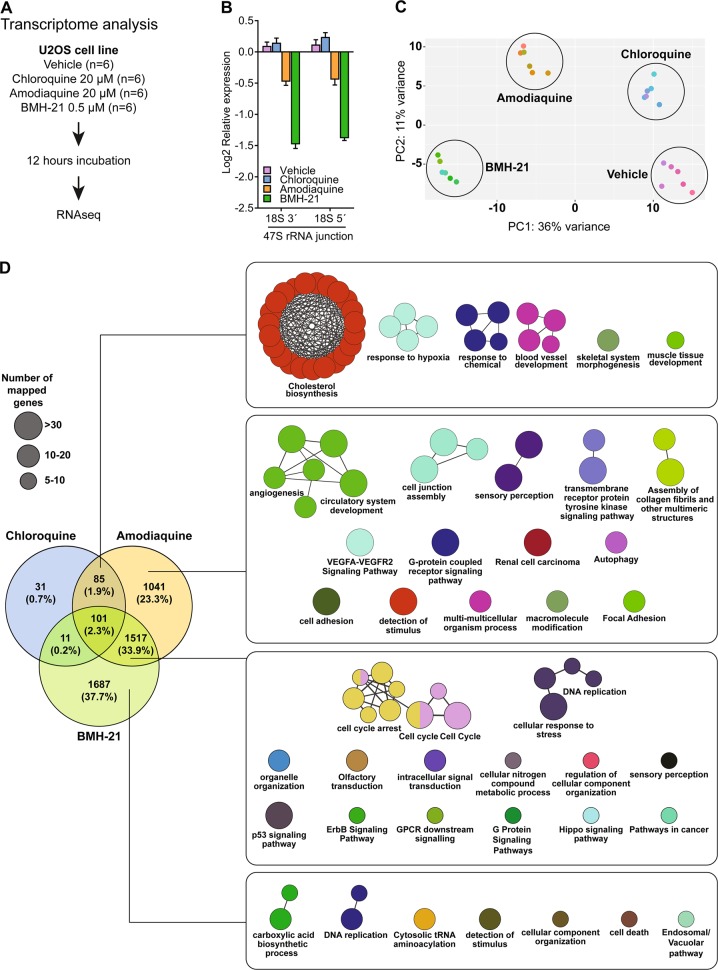
Fig. 4.
Transcriptional perturbation induced by Amodiaquine resembles that of Chloroquine and BMH-21. a Experimental design for RNAseq analysis. b AQ reduces the synthesis of 47S with less intensity than BMH-21. RT-qPCR analysis for the 18S 3′ and 5′ junctions in the 47S rRNA transcript for cells treated as in a. Data shown as mean ± SD of three treatments. c Principal component analysis based on RNAseq data, color-coded according to each treatment. The scatter plot shows the position of samples based on the two first principal components. d Gene ontology and pathway analysis comparing common and unique features among differentially expressed genes disrupted by AQ, CQ, and BMH-21. ClueGO integrates GO terms and pathways to create a functionally organized network. Node size represents amount of mapped genes and node color is assigned randomly. Nodes with two colors contains genes that converged from different databases

