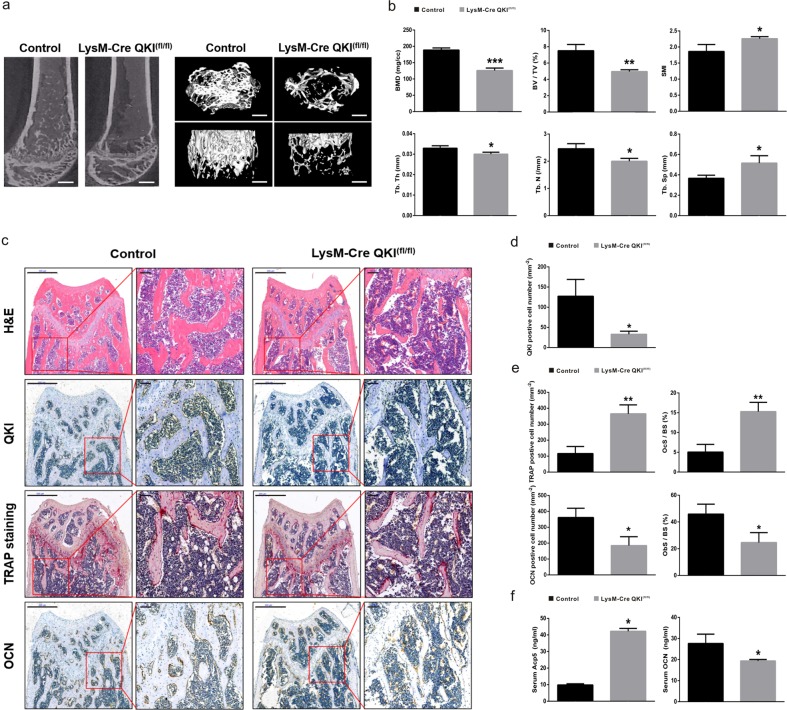
Fig. 1. Decreased bone mass and increased OC number in 8-week-old KO mice.
a Representative μCT reconstructed images of trabecular bone from KO or control group. Scale bar, 200 μm (left image, sagittal view of metaphyseal region; top in right image, horizontal view; bottom, coronal view). b Quantification of BMD, BV/TV, Tb.Th, Tb.N, Tb.Sp, and SMI were measured. n = 6, *P < 0.05, **P < 0.01, ***P < 0.001. c Histological analysis of H&E, TRAP staining, and QKI, OCN IHC in femur metaphyseal region. Scale bar, 500 μm in left image in each group and 100 μm in right image in each group. d, e The data shown as the mean ± sd. OcS/BS osteoclast surface per bone surface, ObS/BS osteoblast surface per bone surface. n = 6, *P < 0.05, **P < 0.01. f Serum Acp5 and OCN abundance in KO and control mice. n = 6, *P < 0.05.

