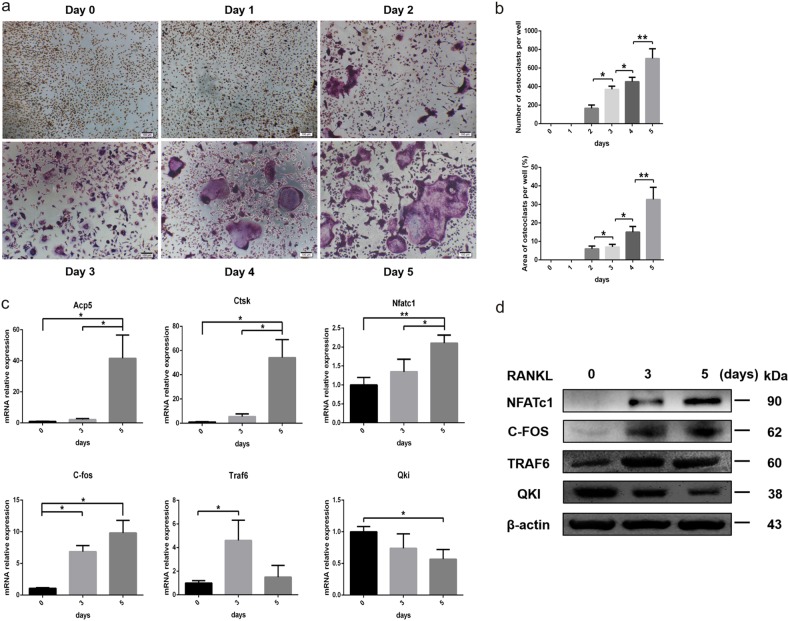
Fig. 2. During osteoclastogenesis, QKI expression decreased gradually.
a TRAP staining was performed in BMMs treated with 25 ng/ml M-CSF and 50 ng/ml RANKL on day 5. Scale bar, 100 μm. b The number and area of TRAP-positive cells were counted. n = 5, *P < 0.05, **P < 0.01. c qt-PCR analysis of OC formation specific genes and Qki gene. n = 4, *P < 0.05, **P < 0.01. d Western blot analysis of OC formation important transcription factors and QKI expression.

