Fig. 6.
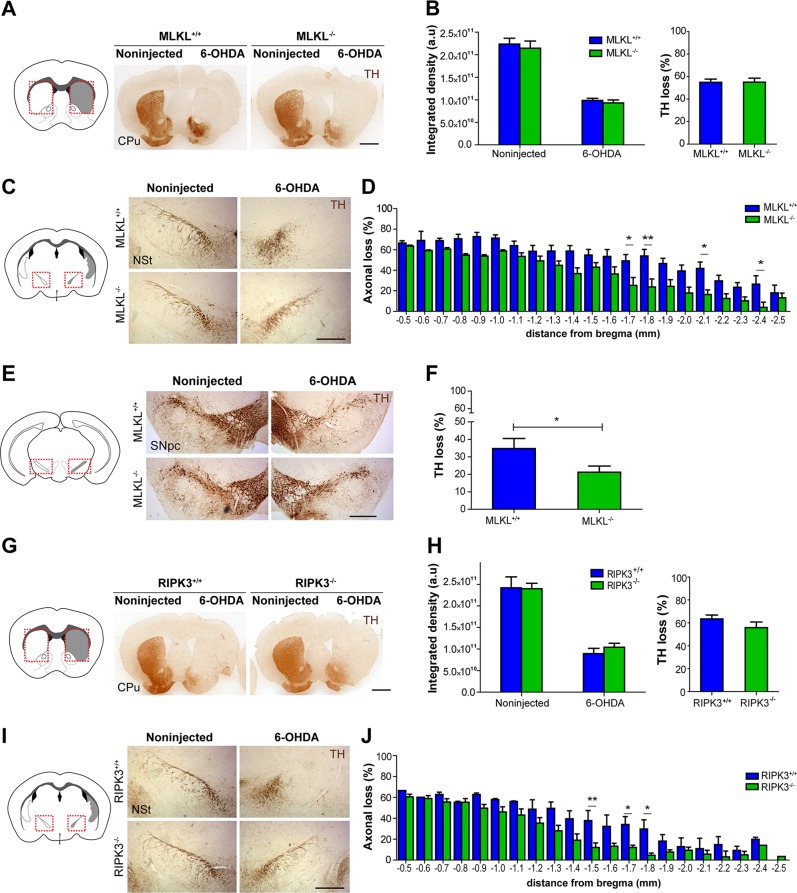
MLKL and RIPK3 deficiency delays neurodegeneration after 6-OHDA injection. MLKL−/−, RIPK3−/−, and corresponding WT sibling mice were injected with 6-OHDA in the right striatum (CPu) and the contralateral hemisphere was kept noninjected as a control. Serial coronal sections of the entire nigrostriatal circuit were obtained 7 days after 6-OHDA injection and immunostained for TH. a Left, scheme of striatal region analyzed. a Right, representative striatal coronal sections from MLKL−/− and MLKL+/+ mice unilaterally injected with 6-OHDA in the right striatum. Scale bar, 1 mm. b Left, striatal denervation was calculated as total integrated optical density in noninjected and injected hemisphere. b Right, percentage of TH loss staining was estimated from integrated density. c Left, scheme of nigrostriatal pathway region analyzed. c Right, representative images from nigrostriatal axons (NSt) from MLKL−/− and MLKL+/+ mice injected and immunostained for TH. Scale bar, 500 µm. d Spatial distribution of axonal loss in each genotype. e Left, scheme of substantia nigra region analyzed. e Right, 6-OHDA induced neuronal loss in MLKL−/− and MLKL+/+ mice analyzed in the substantia nigra pars compacta (SNpc). Scale bar, 500 µm. f Quantification of total number of TH-positive cells in the entire SNpc represented as the percentage of neuronal loss in each genotype. g Left, scheme of striatal region analyzed. g Right, representative striatal coronal sections from RIPK3−/− and RIPK3+/+ mice injected with 6-OHDA in the right striatum. Scale bar, 1 mm. h Left, striatal integrated density (h, right) and percentage of TH loss calculated in each condition. i Left, scheme of nigrostriatal pathway region analyzed. i Right, representative coronal sections from nigrostriatal pathway in RIPK3−/− and RIPK3+/+ injected mice. Scale bar, 500 µm. j Spatial distribution of axonal loss in each genotype. Data are shown as mean ± SEM. Statistical differences were analyzed using two-way ANOVA followed by Bonferroni’s post hoc test in b and h, for Integrated density measurements, d and j, and by student’s t-test in b, f and h, for percentage of loss. *p < 0.05; **p < 0.01. n = 8 animals per group

