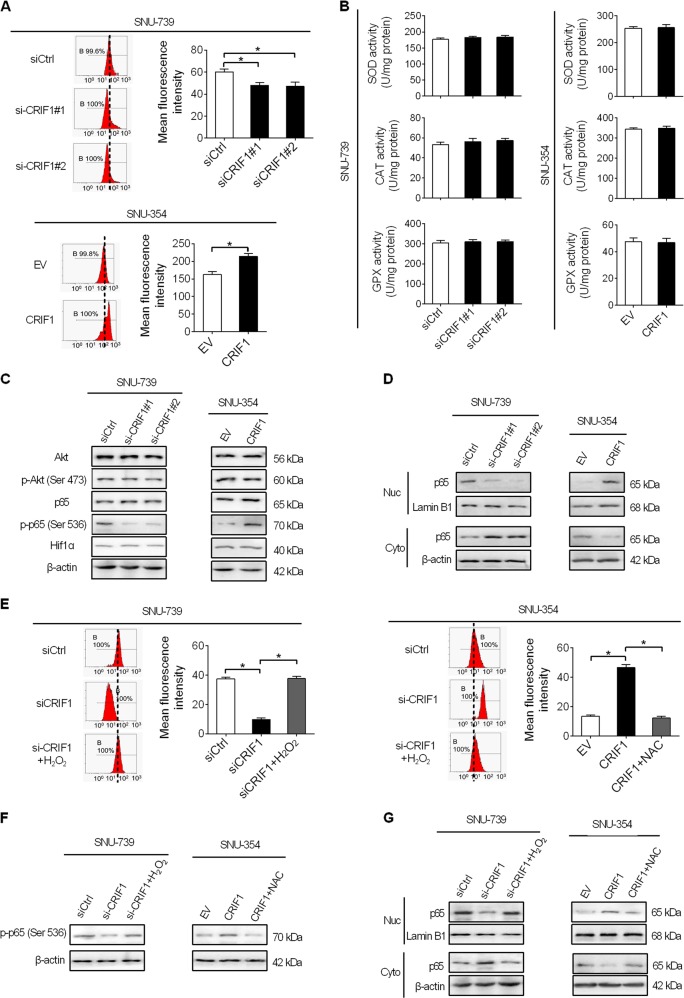
Fig. 5. CRIF1 activated ROS/NFκB signaling in HCC cells.
a Detection of intracellular ROS levels by flow cytometry analysis in SNU-739 and SNU-354 cells with treatment as indicated (siCRIF1, siRNA against CRIF1; siCtrl, control siRNA; EV, empty vector; CRIF1, expression vector encoding CRIF1). b Detection of activities of SOD, CAT, and GPX in SNU-739 and SNU-354 cells with treatment as indicated. c Western blot analyses for levels of Akt, p-Akt (Ser473), p65, p-p65 (Ser536), and HIF1a in SNU-739 and SNU-354 cells with treatment as indicated. d Western blot analyses for nuclear and cytosolic levels of p65 in NU-739 and SNU-354 cells with treatment as indicated. e Intracellular ROS levels analyzed by flow cytometry in SNU-739 and SNU-354 cells treated as indicated. Cells were treated with 100 mM H2O2 or 20 mM NAC for 12 h. f, g Western blot analyses for total cellular levels of p-p65 (Ser536) and nuclear and cytosolic levels of p65 in SNU-739 and SNU-354 cells treated as indicated. Cells were treated with 100 mM H2O2 or 20 mM NAC for 12 h.

