
Fig. 1.
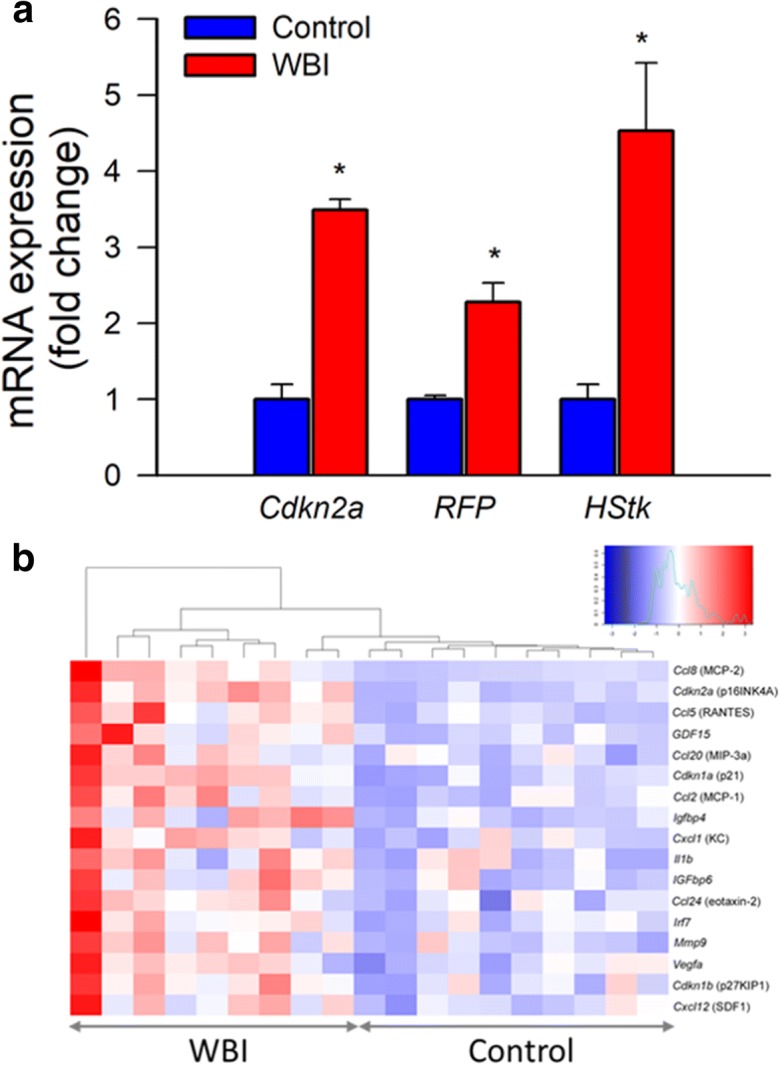
Transcriptional footprint of increased cellular senescence in the cortex of WBI-treated mice. Panel a Taqman qPCR data showing that WBI results in increased expression of the senescence marker Cdkn2a (p16Ink4a) and the senescence indicators RFP and herpes simplex virus thymidine kinase (HStk) in the cortices of WBI p16-3MR mice as compared with those in control p16-3MR mice. Data are mean ± SEM (n = 9–10 for each data point). *P < 0.05 vs. control. Brains were analyzed 6 months post-WBI. Panel b Heat-map depicting normalized log2-fold changes in mRNA expression of senescence markers and components of the senescence-associated secretory phenotype in the cortices of control and WBI-treated mice. The WBI-induced changes in the expression of each gene depicted is statistically significant