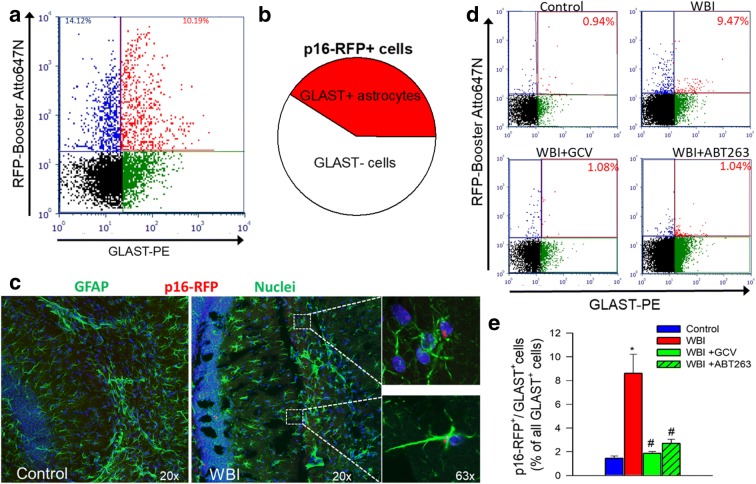
Fig. 3.
GCV and ABT263 treatment successfully deplete senescent astrocytes from WBI-treated p16-3MR mice. Panel a Flow cytometric detection of RFP+/GLAST+ senescent astrocytes and RFP+/GLAST-senescent non-astrocytic cells in single-cell suspension obtained from the brain of a WBI-treated p16-3MR mouse, which was enriched for RFP+ cells by FACS. Dot plot of RFP-Booster Atto647N fluorescence (which correlates with p16-3MR expression) versus GLAST-PE (phycoerythrin) fluorescence depicts the percentages of senescent astrocytes with bright fluorescence in both channels and that of RFP+/GLAST-senescent non-astrocytic cells. Panel b Pie chart showing the percentage of GLAST+ senescent astrocytes as a percentage of all senescent (RFP+) cells. Panel c Fluorescence micrographs of p16-RFP detection in GFAP+ astrocytes in the hippocampus of a WBI-treated p16-3MR mouse. Note that ~ 10% of GFAP+ astrocytes exhibit red RFP-Booster Atto647N fluorescence. Panel d Flow cytometric detection of RFP+/GLAST+ senescent astrocytes in single-cell suspensions obtained from the brains of control p16-3MR mice and WBI-treated p16-3MR mice that received vehicle, ganciclovir (GCV), or the senolytic drug ABT263. Dot plots of RFP-Booster Atto647N fluorescence versus GLAST-PE fluorescence depict the ratio of senescent astrocytes as a percentage of all GLAST+ astrocytic cells. Brains were analyzed 6 months post-WBI. Summary data are shown in panel d. Note that WBI significantly increases the presence of senescent astrocytes in the mouse brain, which is reversed by both GCV and ABT263 treatment. Data are mean ± SEM (n = 4 for each data point). *P < 0.05 vs. control, #P < 0.05 vs. WBI

