Fig. 3.
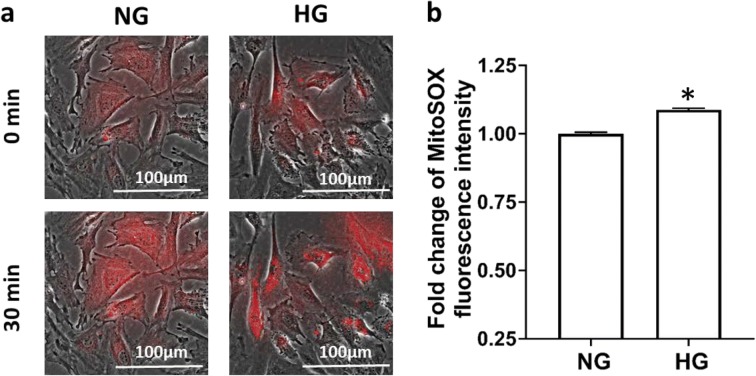
Comparison of the production of mitochondrial superoxide in HG- and NG-treated CVSMCs. a Representative images of MitoSOX staining. b Quantitative analysis of the fold change of MitoSOX fluorescence intensity in CVSMCs. Primary CVSMCs were isolated from five rats, and experiments were repeated three times. a.u., arbitrary unit. NG, normal glucose; HG, high glucose; CVSMCs, cerebral vascular smooth muscle cells. Mean values ± SE are presented. Asterisk (*) indicates P < 0.05 from the corresponding value in HG- versus NG-treated cells

