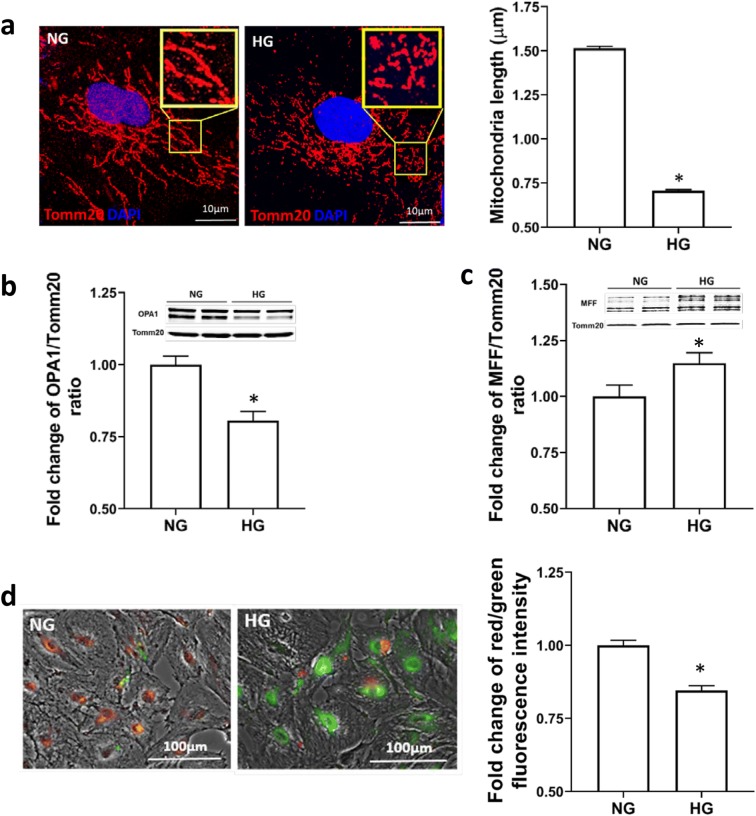
Fig. 5.
Determination of mitochondrial fission and fusion processes and ΔΨm in CVSMCs. a Representative images (× 1000 magnification) of the morphology of mitochondria and comparison of the mitochondria length in HG- vs. NG-treated CVSMCs. Red fluorescence represents Tomm20, and blue fluorescence represents Hoechst. b Representative images of Western blots and quantification of the ratio of OPA1 to Tomm20 in HG- vs. NG-treated cells. c Representative images of Western blots and quantification of the ratio of MFF to Tomm20 in HG- vs. NG-treated cells. d Representative images of JC1 staining and quantitative analysis of the ratio of red to green fluorescence intensity in HG vs. NG-treated CVSMCs. Primary CVSMCs were isolated from five rats, and experiments were all repeated three times. NG, normal glucose; HG, high glucose; CVSMCs, cerebral vascular smooth muscle cells

